Download
1 / 30
300 likes | 453 Views
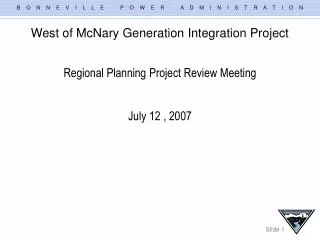
West of McNary Generation Integration Project. Regional Planning Project Review Meeting July 12 , 2007. Presentation Outline. Background Objective Study Assumptions Study Methodology Study Results Next Steps. Background.

E N D
West of McNary Generation Integration Project Regional Planning Project Review Meeting July 12 , 2007
Presentation Outline • Background • Objective • Study Assumptions • Study Methodology • Study Results • Next Steps
Background • In 2001, natural gas generation additions were being proposed near Lower Monumental and McNary. These included Starbuck (1200MW) and Wallula (1300MW). • Integration into the 500-kV grid • Existing transfer capability across West of McNary was fully utilitized • Identified McNary-John Day 500-kV project to provide firm transmission service to these generators. • Identified a bottleneck West of John Day with the addition of the McNary-John Day 500-kV project.
Background • What’s Changed • Generation type and location • Wind instead of natural gas • West of McNary Substation instead of east of McNary Substation • Integrated not only to 500 kV, but also into the 69 kV, 115 kV and 230-kV system • Numerous requests • The amount of wind generation integration requests into Slatt and John Day are at a point where transmission reinforcement is needed.
McNary Slatt Big Eddy John Day
Objective This study investigates different infrastructure improvement options that will increase transmission capacity across West of McNary (WOM), West of Slatt (WOS)and West of John Day(WOJ) paths in order to provide transmission service to the proposed generation in the area, improve system performance and address reliability issues of the system.
Study Methodology Task 1) Screening of Alternatives based on all lines in service Task 2) Thermal screening of the better performing Alternatives Task 3) Determine Total Transfer Capacity (TTC) across WOM, WOS and WOJ paths Task 4) Voltage Stability Analysis Task 5) Transient Stability Analysis
Study Assumptions Task 1) Screening of Alternative Projects • The starting basecase for the study was A08ATC_WOM with a generation pattern consistent with ATC assumption prepared from a August 2008 case. It was conditioned by increasing generation at McNary, Upper Columbia, and Lower Snake plants. • In addition to existing 300 MW wind generation, 400 MW wind generation at Jones Canyon was added. Also, 316 MW Plymouth and 80 MW at Wallula was modeled at McNary 500-kV to further stress the WOM & WOS paths to 3583 MW & 4403 MW respectively (A08ATC_WOM3583_WOS4403). (The Plymouth & Wallula generation was chosen to model indicative stress not as an actual plant) • The flow on COI and PDCI was adjusted to 4505 MW and 2700 MW.
Study Assumptions Task 2) Thermal screening of the better performing Alternatives • Using A08ATC_WOM3583_WOS4403 basecase fromTask 1) three basecases were created to stress each path (WOM,WOS &WOJ) by simulating three different generation patterns. • WOM path was stressed by increasing 720 MW additional generation at Wallula. (The Wallula generation was chosen to model indicative stress not as an actual plant) • WOS path was stressed by adding 768 MW proposed wind generation at Slatt substation and an additional 150 MW proposed wind generation at Boardman. • WOJ path was stressed by adding 700 MW proposed wind generation at John Day substation.
Study Assumptions • Task 3) Determine Total Transfer Capacity (TTC) across WOM, WOS and WOJ Paths • The starting basecase for determining the WOM TTC used a August 2010 (a10cy07r5b) budget case. • From the a10cy07r5b case two cases with the WOM path flow at 3500 MW and 4500 MW were created. The McNary – John Day project was modeled and included in the new definition of WOM. • WOM3500_MCN-JD WOM4500_MCN-JD • From the two cases above, four additional cases modeling the John Day – Big Eddy 500 kV line #3 and the Big Eddy – Station Z 500 kV project were created. • WOM3500_MCN-JD_JD –BE #3 WOM3500_MCN-JD_BE –Station Z • WOM4500_MCN-JD_JD –BE #3 WOM4500_MCN-JD_BE –Station Z • The John Day – Big Eddy 500 kV line #3 and the Big Eddy – Station Z 500 kV projects are included in the new definition of WOJ.
Study Assumptions • Task 3) con’t • The starting basecase for determining the WOS TTC used a August 2010 (a10cy07r5b) budget case. • From the a10cy07r5b case two cases with WOS path flow at 5000 MW and 5500 MW were created. The McNary – John Day project is modeled and included in the new definition of WOS. • WOS5000_MCN-JD WOS5500_MCN-JD • From the two cases above, four additional cases modeling the John Day – Big Eddy 500 kV line #3 and the Big Eddy – Station Z 500 kV project were created. • WOS5000_MCN-JD_JD –BE #3 WOS5000_MCN-JD_BE –Station Z • WOS5500_MCN-JD_JD –BE #3 WOS5500_MCN-JD_BE –Station Z • The John Day – Big Eddy 500 kV line #3 and the Big Eddy – Station Z 500 kV projects are included in the new definition of WOJ.
Study Assumptions • Task 3) con’t • The starting basecase for determining the WOJ TTC used a August 2010 (a10cy07r5b) budget case. • From the a10cy07r5b case the McNary – John Day was modeled. The Big Eddy – Station Z 500 kV project was also added and included in the new definition of WOJ. Two cases with WOJ flow at 3000 MW and 3378 MW were created. • WOJ3000_MCN-JD_BE –Station Z WOJ3378_MCN-JD_BE –Station Z • From the a10cy07r5b case the McNary – John Day was modeled. The John Day -Big Eddy #3 500 kV project was also added and included in the new definition of WOJ. Two cases with WOJ flow at 3000 MW and 3500 MW were created. • WOJ3000_MCN-JD_JD-BE #3 WOJ3500_MCN-JD_JD-BE #3
Study Results • Task 1) Screening of Study Alternatives • An August 2008 caserepresenting the critical season in the McNary area with high hydro plant output, high thermal output and high North of John Day flow. • Each study Alternative wasmodeled • Performance of each study Alternative was then ranked based on the following • On higher loading of new transmission line. • Lower loading of existing critical transmission lines and paths. • Other system performance observations and issues.
Study Results • Task 1) con’t • Basecases containing the following nine Alternatives were prepared. The performance of each Alternative with all lines in service was assessed. • 1) McNary – John Day • 2) McNary – Big Eddy • 3) McNary – Station Z • 4) McNary – John Day – Big Eddy • 5) McNary – John Day & Big Eddy – Station Z • 6) McNary – John Day, John Day – Big Eddy & Big Eddy – Station Z • 7) McNary – John Day, John Day – Station Z & Big Eddy – Station Z • 8) McNary – Station Z & Big Eddy – Station Z • 9) McNary – Big Eddy & Big Eddy – Station Z
Study Results • Task 1: con’t • The following were better performing Alternatives • McNary-John Day 500-kV: • Unloading the WOM/WOS paths more and increasing the TTC • Providing better voltage support • Increased capability brought by McNary – John Day project will not be fully utilized until WOJ limitation is addressed • McNary-John day 500-kV/Big Eddy-Station Z 500-kV • Increases WOM/WOS TTC. • Increases WOJ TTC • Flow across North of John Day are better balanced which reduces reactive losses and improves voltage stability performance. • Provides support to Portland load service area. Fits into the long-range development plan of the system • McNary-John Day 500-kV and John Day-Big Eddy #3 500-kV • Increases WOM/WOS path TTC • Increases WOJ TTC • Improved voltage support
Study Results • Task 2: Thermal screening of the better performing Alternatives • WOM - McNary – John Day & Big Eddy – Station Z 500 kV performs better on all lines West of McNary. • WOS - McNary – John Day & Big Eddy – Station Z 500 kV performs better on all lines West of Slatt. • WOJ - McNary – John Day – Big Eddy 500 kV project performs better for unloading John Day -Big Eddy line 1&2 but McNary – John Day & Big Eddy – Station Z 500 kV performs better on all lines West of John Day. • No new overload as result of these projects.
Study Results • Task 3) Determine Total Transfer Capacity (TTC) across WOM Path • All single line contingencies in the area and credible double line contingencies with applicable RAS in the area were run. • The transfer capacity of WOM was calculated and tabulated. WOS and WOJ path limits for this particular generation level and pattern were also tabulated and summarized for comparison.
Study Results • Task 3) con’t • The existing WOM path is limited by the Ashe–Slatt / Coyote–Slatt 500 kV double line outage with applicable RAS. The most limiting element is the McNary – Horse Heaven 230 kV line followed by McNary – Ross 345 kV line and McNary – Santiam 230 kV line. The WOM capability based on continuous limit is 2870 MW.
Study Results • Task 3) Determine Total Transfer Capacity (TTC) across WOS Path • All single line contingencies in the area and credible double line contingencies with applicable RAS in the area were run. • The transfer capacity of WOS was calculated and tabulated. WOM and WOJ paths limits for this particular generation level and pattern were also tabulated and summarized for comparison.
Study Results • Task 3) con’t • The existing WOS path is limited by Ashe–Marion / Slatt – Buckley 500 kV double line outage with applicable RAS. The most limiting element is Slatt – John Day 500 kV line. • The WOS capability is 4100 MW.
Study Results • Task 3) Determine Total Transfer Capacity (TTC) across WOJ Path • All single line contingencies in the area and credible double line contingencies with applicable RAS in the area were run. • The transfer capacity of WOJ was calculated and tabulated. WOM and WOS paths limits for this particular generation level and pattern were also tabulated and summarized for comparison.
Study Results • Task 3) con’t • WOJ Path is limited by John Day - Big Eddy 500 kV #1 single line outage. (No Applicable RAS). The limiting element is John Day – Big Eddy 500 kV # 2 line. • The path is limited to 2440 MW.
Recommended Alternative • McNary-John Day 500-kV & Big Eddy-Station Z • Increases WOM/WOS TTC. • Increases WOJ TTC • Flow across North of John Day is better balanced which reduces reactive losses and improves voltage stability performance. • Provides support to Portland load service area. Fits into the long-range development plan of the system • Depending on where new generation is integrated the following approximate TTC increase results. • WOM 2870 MW up to 4500 MW • WOS 4100 MW up to 5500 MW • WOJ 2440 MW up to 3400 MW
Next Steps • Complete Task 4 and 5. • Complete Regional Planning Project Review. • Submit Regional Planning Project Review Report to WECC PCC and TSS.