Download
1 / 6
0 likes | 7 Views
Financial trading is a process of identifying the right assets at the right time to take advantage of their price fluctuation. Support and resistance are the crucial technical analysis indicators that help you throughout the trade in making informed decisions. In this article, we will understand the key concept of these support and resistance indicators and how they work.<br><br>

E N D
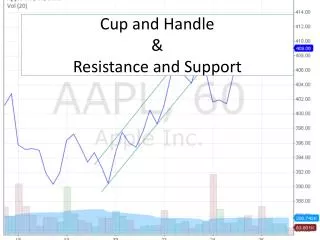
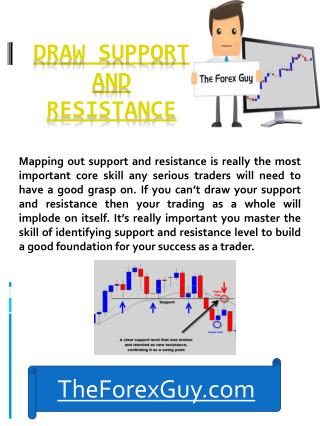
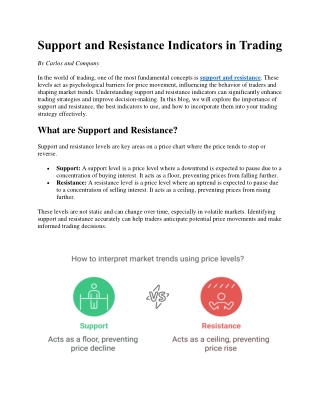
Support and Resistance Indicators in Trading By Carlos and Company In the world of trading, one of the most fundamental concepts is support and resistance. These levels act as psychological barriers for price movement, influencing the behavior of traders and shaping market trends. Understanding support and resistance indicators can significantly enhance trading strategies and improve decision-making. In this blog, we will explore the importance of support and resistance, the best indicators to use, and how to incorporate them into your trading strategy effectively. What are Support and Resistance? Support and resistance levels are key areas on a price chart where the price tends to stop or reverse. •Support: A support level is a price level where a downtrend is expected to pause due to a concentration of buying interest. It acts as a floor, preventing prices from falling further. •Resistance: A resistance level is a price level where an uptrend is expected to pause due to a concentration of selling interest. It acts as a ceiling, preventing prices from rising further. These levels are not static and can change over time, especially in volatile markets. Identifying support and resistance accurately can help traders anticipate potential price movements and make informed trading decisions.
Importance of Support and Resistance in Trading Understanding support and resistance is crucial because: 1.Helps Identify Entry and Exit Points: Traders can enter buy positions near support levels and sell positions near resistance levels. 2.Confirms Trend Reversals: A break above resistance or below support often signals a trend reversal or continuation. 3.Manages Risk Effectively: Setting stop-loss orders around these levels helps minimize losses. 4.Works in All Timeframes: Whether you are a day trader or a long-term investor, support and resistance are applicable across all timeframes. Top Support and Resistance Indicators Several technical indicators help traders identify and validate support and resistance levels. Let’s explore the most effective ones: 1. Moving Averages Moving averages smooth out price data to identify trends. They also act as dynamic support and resistance levels. •Simple Moving Average (SMA): The average price over a set number of periods. Commonly used SMAs are 50, 100, and 200-day SMAs. •Exponential Moving Average (EMA): Gives more weight to recent prices, making it more responsive to price changes. How to use: When the price is above a moving average, it acts as support. When below, it acts as resistance. 2. Trendlines Trendlines are drawn on charts to connect a series of highs or lows. They act as diagonal support and resistance levels. How to use: •An upward trendline connects higher lows and acts as support. •A downward trendline connects lower highs and acts as resistance. •A break above or below a trendline can indicate a trend reversal.
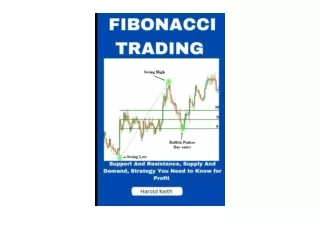
3. Pivot Points Pivot points are calculated using the previous day’s high, low, and close prices. They help determine potential support and resistance levels for the current trading day. How to use: •The pivot point itself acts as the primary support/resistance. •Above the pivot point are resistance levels (R1, R2, R3). •Below the pivot point are support levels (S1, S2, S3). •Traders use pivot points to gauge market sentiment and set trade entry/exit points. 4. Fibonacci Retracement Fibonacci retracement is based on the Fibonacci sequence and identifies key retracement levels where price corrections may occur. Common levels include 23.6%, 38.2%, 50%, 61.8%, and 78.6%. How to use: •During an uptrend, these levels act as support. •During a downtrend, they act as resistance. •A bounce from a Fibonacci level confirms its strength as support or resistance. 5. Bollinger Bands Bollinger Bands consist of a middle moving average line and two outer bands that represent standard deviations. How to use: •The upper band acts as resistance. •The lower band acts as support. •When the price touches the bands, it often signals overbought or oversold conditions. 6. Volume Profile Volume profile shows trading activity at different price levels. It helps identify high-volume areas (strong support/resistance) and low-volume areas (weak support/resistance). How to use: •High Volume Nodes: Areas with high trading activity serve as strong support or resistance. •Low Volume Nodes: Prices tend to move quickly through these areas, making them weak support or resistance zones.
7. Psychological Levels Round numbers like $10, $50, $100, 10,000 (for indices) often act as support and resistance because traders tend to place buy and sell orders around these levels. How to use: If the price approaches a major round number, it may face resistance or support due to increased buying or selling pressure.
How to Trade Using Support and Resistance Indicators 1. Identify Key Levels Use a combination of indicators to identify strong support and resistance areas. Look at historical price reactions at these levels. 2. Wait for Confirmation Instead of blindly entering a trade at support or resistance, wait for confirmation through candlestick patterns, volume increase, or other indicators. 3. Use Stop-Loss and Take-Profit •Place stop-loss orders slightly beyond support or resistance levels to protect against false breakouts. •Set take-profit targets near opposite levels to lock in profits. 4. Combine with Other Indicators Support and resistance work best when used with trend indicators (like RSI, MACD) and volume analysis for better accuracy. 5. Adjust for Market Conditions •In trending markets, support and resistance levels shift. •In ranging markets, prices tend to bounce between established levels. •Adjust your strategy accordingly. Conclusion Support and resistance are foundational concepts in trading, helping traders identify profitable opportunities and manage risks. By using indicators such as moving averages, trendlines, pivot points, Fibonacci retracements, Bollinger Bands, and volume profile, traders can gain a clearer picture of market behavior. At Carlos and Company, we emphasize the importance of technical analysis in developing a robust trading strategy. Whether you are a beginner or an experienced trader, mastering support and resistance indicators will elevate your trading skills and improve your market predictions. Stay tuned for more insights from Carlos and Company, the best signal provider in the market! Happy trading!