Download

1 / 9
90 likes | 237 Views
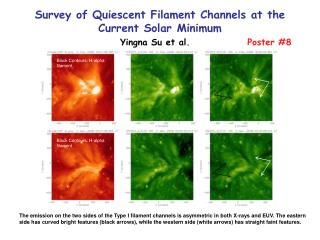
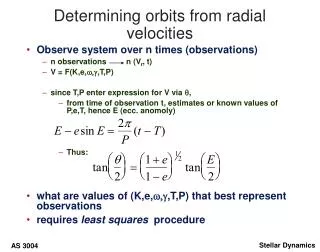
The H-alpha radial velocities of an arch filament system in solar emerging flux region. Shino Kawahara Rakutou High School KYOTO. On emerging flux region : EFR. In H-alpha images, we can observe black bands between sun spots pair in early stage.

E N D
The H-alpha radial velocities of an arch filament system in solar emerging flux region Shino Kawahara Rakutou High School KYOTO
On emerging flux region:EFR • In H-alpha images, we can observe black bands between sun spots pair in early stage. • It is believed that these black bands are emerging flux tubes. • These tubes were made in convection zone in solar interior, and rose to the surface. • These areas are called as emerging flux region (EFR) , and black bands as arch filament system (AFS).
It is believed that there are flux tubes which move upward about 10km/s at the center, and the downward moving of about 30km/s to 50km/s at both ends of the arch. • Then we examined distributions of velocity in AFS by means of Doppler shift measurements of H-alpha lines.
Observation and Analysis • Using the 70cm coelostat telescope and the high dispersion spectrogram, we observed the solar surface phenomena atKwasan observatory on 10th and 11th of Aug. in 2006. • We observed sunspots group NOAA0904. • We performed Doppler shift measurements of H-alpha lines of each AFS’s. • We derived the radial velocities of each AFS’s from following formula Δλ/λ=V/c (Δλ: Doppler shift of H-alpha line center, λ: H-alpha wave length, V: radial velocity, c: velocity of light)
Fig.1 The spectral image of sun spotsNOAA0904 (left), H-alpha image ofthe slit mirror of the spectrogram(right) BlueRed Observing time of both figures is 2:25 on the 10th of Aug. in 2006(UT)
H-α center Relative intensity Shortward (blue) Wavelength (in pixel units) Longward (red) Fig.2 The spectral trace was made from Fig1.
Results • The three radial velocity observations obtained between 2:25 to 2:40 10th of Aug. show; The eastward;No observation. The center;-14.5km/s、-15.4km/s The westward;+0.7km/s • The mean radial velocities from 12 observations obtained between 0:42 to 1:56 11th of Aug. show ; The eastward;+2.1km/s (±1.13km/s)、 The center;-13.1km/s(±2.8km/s)、 The westward;-0.5km/s
Line of sight Results 2 The solar surface Mean value -13.1km/s Mean value -0.5km/s Sun spots Mean value +2.1km/s AFS The radial velocities of upward flux of central region are observed higher values among three regions. The other hand, the radial velocities of downward flux of each ends are observed not so high.
Acknowledgment • We thank Drs. Shibata, Kurokawa and Ishii, and staffs of Kwasan observatory. This work was supported by SPP/JST (2006).