Download
1 / 35
350 likes | 503 Views
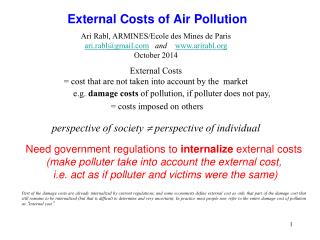
Ari Rabl, ARMINES/ Ecole des Mines de Paris ari.rabl@gmail.com and www.arirabl.org November 2013 External Costs = cost that are not taken into account by the market e.g. damage costs of pollution, if polluter does not pay, = costs imposed on others

E N D
Ari Rabl, ARMINES/Ecole des Mines de Parisari.rabl@gmail.com and www.arirabl.orgNovember 2013 • External Costs = cost that are not taken into account by the market • e.g. damage costs of pollution, if polluter does not pay, • = costs imposed on others • perspective of society perspective of individual • Need government regulations to internalize external costs • (make polluter take into account the external cost, • i.e. act as if polluter and victims were the same) • Part of the damage costs are already internalized by current regulations, and some economists define external cost as only that part of the damage cost that still remains to be internalized (but that is difficult to determine and very uncertain). In practice most people now refer to the entire damage cost of pollution as “external cost”. External Costs of Air PollutionTRADD, part 1
Most air pollution, (and a large part of all pollution) is directly or indirectly linked to energy (electricity, heat, transport) Combustion of fossil fuels: CO2 ( global warming) NOx( acid rain, tropospheric O3, health impacts) SOx( acid rain, health impacts) black smoke, particles ( health impacts) other: nuclear waste CFCs (insulation, refrigeration) ( stratospheric O3 hole) Land use (power plants, mines, wastes, ...) Accidents(mines, Chernobyl, ...) Noise etc … Sources of Pollution
Pollution data France Source: http://www.citepa.org/emissions/nationale
Pollution data France, cont’d Mais le CO2
Difficult choices(high costs): • e.g. • pay extra for clean energy? • photovoltaics? • "zero emission" vehicles? • fuel cell car? • improved flue gas treatment? • e.g. catalytic reduction of NOx • close a factory with high pollution? • cancers or jobs? • Excessive spending for environmental protection takes money away from other worthy causes, such as education and public health • Cost-benefit analysis (CBA) • can help optimize allocation of scarce resources, • i.e. compare costs and benefits of pollution abatement How much is clean air worth? pollution abatement = measures to reduce pollution
= Ranking of abatement measures in terms of their result/cost ratio. Example: CO2 abatement in EU by 2020 (reference: IIASA, GAINS model) Each segment of the curve represents marginal cost (€/tCO2) and contribution to abatement (GtCO2/yr) of a particular abatement measure, e.g. replacement of incandescent lighting by fluorescent. Cost-Effectiveness Analysis (CEA) CEA does not tell us how far we should abate; for that we need to know also the benefits (cost-benefit analysis)
1) Zero pollution: Unrealistic, our economy could not function • 2) Precautionary principle: no useful guidance • 3) Stay below threshold of harmful impacts: • OK if there is such a threshold (often the case for ecosystem impacts) • but for many pollutants/impacts there is no such threshold, • e.g. greenhouse gases, health impacts of NOx, PM, SO2, O3, carcinogens, … • 4) Minimize the total social cost Ctot(E) = Cdamage(E) + Cabatement(E) • as function of pollution emission E • Marginal damage cost = - marginal abatement cost = optimal pollution tax Criteria for DeterminingOptimal Level of Pollution
only a general guideline (“Think before you act!”), no advice for specific problems Must be used with a great deal of precaution, to avoid unexpected consequences e.g. Overestimating risks of nuclear implies increased global warming and conventional pollution Overestimation of mortality costs of pollution implies increased mortality through indirect impacts (“poverty kills”) Whose risks, whose precaution? We need expectation value of damage costs, except for cases where valuation is very non-linear function of damage (e.g. very large accident, or irreversible damage) The Precautionary Principle
Example: costs of CO2 General case (almost always): Marginal abatement costdecreases with E Typical case for classical air pollutants: Marginal damage cost = constant for CO2: Marginal damage cost increases with E Optimal level of pollution, cont’d At optimum
ExternE = “External Costs of Energy” Series of research projects funded by European Commission DG Research, since 1991 (until 1995 with ORNL/RFF) >200 scientists in all countries of EU (A. Rabl is one of the key participants) Major publications 1995, 1998, 2000, 2004, and 2008 (definitive results) www.externe.info Methodology 1) Life Cycle Assessment of process or product chain (LCA) 2) Site specific Impact Pathway Analysis (IPA) Towards an answer: the ExternE Project Series of the EC
to calculate damage of a pollutant emitted by a source • Impacts are summed over entire region that is affected (Europe) • and all damage types that can be quantified: • health • loss of agricultural production • damage to buildings and materials • Result: • €/kg of pollutant • Multiply by kg/kWh to get €/kWh Impact Pathway Analysis
For many persistent pollutants (dioxins, As, Cd, Cr, Hg, Ni, Pb, etc) ingestion dose is about two orders of magnitude higher than inhalation Pathways for Dioxins and Toxic Metals
Relation between impact pathway analysis and current practice of most LCA, illustrated for the example of electricity production. Life cycle assessment (LCA) LCA should include site-specific IPA with realistic exposure-response functions and monetary valuation - but that’s usually not done in current practice.
Comparison LCIA ExternE Impact 2002+ is the most complete LCIA (life cycle impact assessment) Impact 2002+, like most LCA: no monetary valuation, and tries to include everything (even if the ERFs are dubious) whereas ExternE focuses on items with the largest damage cost, trying to be as realistic as possible
Very limited and simplified list Comparison of tools for evaluating environmental policy options
For non-market goods: based on Willingness-to-pay (WTP) to avoid a loss e.g. VSL = “Value of Statistical Life” (a better name VPF = value of prevented fatality) = WTP to avoid risk of an anonymous premature death typical values used in EU and USA 1-5 M€ Value of a Life Year (VOLY) due to air pollution = 50,000 € Cancers 2M€/cancer, based on VSL = 1 M€ Monetary valuation • Methods for valuation of non-market goods: • Contingent valuation (survey of individuals) • analysis of consumer choices (e.g. lower rent for noisy apartments, travel cost, higher wage for higher risk, etc)
Contingent valuation, an example Example: As a simple hypothetical example of a contingent valuation for VPF, a questionnaire might ask “For your next vacation you have the choice between a plane ticket for 1000 € from regular company with negligible accident risk and a ticket from a charter company where you have a 1/5000 probability of dying in a plane crash. At what price of the charter ticket are you neutral between the two?” Suppose the mean of the answers is 400 €, what is the implied VPF? Solution: The WTP to avoid 1/5000 death is 1000-400 € = $600 € hence VPF = 600 € * 5000 = 3 million € per death. (don’t worry: the real risk is much smaller)
Information Needs of Policy Makers • Environmental policies need to target specific pollution sources • General policies, e.g. ambient air quality standards, are not sufficient • Policy makers must tell each polluter how much to reduce the emission of each pollutant (e.g, NOx from cars = precursor of O3 and PM10) • They need to know impact (cost) of emitted pollutant • For some decisions the also need LCA results, e.g. • choice between nuclear and coal, • electric or fuel cell vehicle (“pollution elsewhere vehicles”), • hydrogen economy
Land use: • Serious impact on ecosystems and biodiversity • (biodiversity decreases if size of an ecosystem is reduced, e.g. if it is cut by a road) • Very site-specific. • Storage of waste (nuclear and conventional): • Difficulty: damage depends on future management of storage, • with new technologies leakage during the operation of the facility is negligible, but what will happen in the future? • need scenarios Land use, waste storage
ExternE 1995 and 1998: Very low damage costs (lowest of all except wind, solar and for some sites hydro) but … Risks of nuclear proliferation and terrorism: Temptation to increase profit and economies of scale by selling the technology to countries that lack sufficient safeguards (the link nuclear power -> military is undeniable) Long term storage of waste: No problem as long as storage site is supervised. But is our society stable enough in the long term? Risks imposed on future generations: nuclear waste vs. CO2 Risks of major nuclear accident: Extremely small with new technologies, but public perception? Nuclear power
Global temperature and sea level, past From: http://www.ipcc.ch/pdf/assessment-report/ar4/wg1/ar4-wg1-ts.pdf
Scenarios and temperature change SRES = Special Report on Emission Scenarios From: http://www.ipcc.ch/pdf/assessment-report/ar4/syr/ar4_syr.pdf
For the A1B scenario and comparing the period 2080 to 2099 with the control period 1980 to 1999 Predicted changesin precipitation From: http://www.ipcc.ch/pdf/assessment-report/ar4/wg1/ar4-wg1-chapter11.pdf
Physical impacts of global warming Ref: http://www.ipcc.ch/pub/wg2TARtechsum.pdf (Table.TS-1) • Changes of heating and cooling • Changes of agricultural production • Increased incidence of tropical diseases (malaria, dengue fever, …) • Migrations of displaced populations • Extreme weather events (costs = ??) • Ecosystem impacts: species extinction, … (costs = ????) • Social and political problems, especially in poor countries (costs = ????) • Changes in ocean circulation (could be abrupt, ~years) • Some will gain but most will lose
Impact categories of global warming and key difficulties encountered in the estimation of their costs. The last column shows our personal assessment of the uncertainties. Some of the impacts depend not only on the absolute level of DT but also on the rate of change. Monetary valuation of global warming
Various estimates for 2xCO2 loss on the order of 1 to 2 % of gross world product Cost per ton of CO2 depends on discount rate and other controversial assumptions especially “value of life” in developing countries (where most of the damage will occur) The mainstream estimates are around of 20 €/t of CO2 (but is it agreement by imitation?) Valuations by ExternE ExternE 1998: Calculations by ExternE team: 3.8-139 €/tCO2 18-46 €/tCO2 (“restricted range”, geometric mean 29 €/tCO2 ) ExternE 2000: 2.4 €/tCO2 ExternE 2003-2008: 19 to 21 €/tCO2 Monetaryvaluation of global warming, cont’d
Studies in 2004 and 2005 (literature review and detailed modeling) Global warming cost, recent estimates by UK Report by Stern et al in 2006 Damage cost around 85 $/tCO2
Current emissions and implications of a CO2 tax Germany 10 tCO2/yr France 6 tCO2/yr If tax = 20 €/tCO2: for 6 tCO2/yr per per person cost = 120 €/yr per person (France) Implication for electricity (note current average price ~11 cents/kWh): gas (combined cycle) 0.4 kg/kWh0.8 cents/kWh coal (steam turbine) 0.9 kg/kWh1.8 cents/kWh Stabilization at 550 ppm (=2x preindustrial)
Reduce emissions • Shift to renewables or nuclear • Increase efficiency of fossil energy use • carbon sequestration (storing CO2 in depleted reservoirs of natural gas or oil, in aquifers, deep ocean, …) • Life style changes, e.g. eat less red meat, more vegetarian food • Adaptive measures to reduce impacts, e.g. • develop drought resistant crops • change crops • build dikes What do to about global warming?
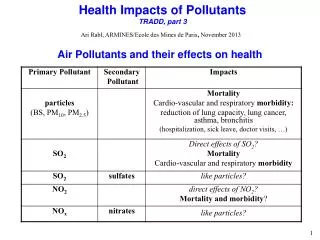
Impacts • 1) Global warming (CO2, CH4, N2O) • 2) NOx, SO2, PM etc(primary & secondary pollutants) • Health (morbidity: ~ 30%, mortality: ~65% of total cost of these pollutants) • The rest is only a few %: • Buildings & materials • Agricultural crops • Acidification & eutrophication • 3) Other burdens • Amenity (noise, visual impact, recreation) • supply security • Technologies • Energy: coal, lignite, oil, gas, biomass, PV, wind, hydro, nuclear • Waste incineration • Transport: cars, trucks, bus, rail, ship, (planes) Impacts and Technologies evaluated by ExternE
1 ppb O3 = 2.00 g/m3 of O3, 1 ppb NO2 = 1.91 g/m3 of NO2, 1 ppb SO2 = 2.66 g/m3 of SO2, 1 ppm CO = 1.16 mg/m3 of CO (all at 20C) BS = black smoke (fuméesnoires) c = concentration CBA = cost-benefit analysis CFC = chlorofluorcarbon CV = contingent valuation ERF= exposure-response function (also known as dose-response function or concentration-response function CRF) EC = European Commission GWP = global warming potential (kg of substance with same radiative forcing as 1 kg of CO2) IPA = impact pathway analysis IPCC = intergovernmental panel on climate change LCA = life cycle assessment (ACV = analyse de cycle de vie) LE = life expectancy (espérance de vie) Morbidity impacts = impacts on health Mortality impacts = increased number of deaths NMVOC = non-methane volatile organic compounds NOx = unspecified mixture of NO and NO2 PMd = particulate matter, with subscript d indicating that only particles with aerodynamic diameter below d, in m, are included (PSd = poussières en suspension) rdis = discount rate (taux d’actualisation) = rate at which one is neutral between a payment P0 today and a payment Pn = P0 (1+rdis)-n in n years from now sERF= slope of ERF UWM = uniform world model for simplified approximate calculation of typical impacts and damage costs vdep = deposition velocity of pollutant (also called removal or depletion velocity) [m/s] VOC = volatile organic compounds (COV = composantesorganiques volatiles) VOLY = value of a life year VPF = value of prevented fatality (= VSL = “value of statistical life”) YOLL = years of life lost Glossary
ExternE 2005. ExternE – Externalities Of Energy: Methodology 2005 Update. Available at http://www.externe.info • ExternE 2008. With this reference we cite the methodology and results of the latest phases of ExternE: NEEDS (2004 – 2008) and CASES (2006 – 2008). The results can be found in the data CD distributed with the CASES book edited by Markandya A, Bigano A and Porchia R in 2010: The Social Cost of Electricity: Scenarios and Policy Implications, Edward Elgar Publishing Ltd, Cheltenham, UK. They can also be downloaded from the corresponding website of the CASES project http://www.feem-project.net/cases/project.php. Here we use the numbers of the data CD because they are a fixed reference unlike the website where some numbers have been changed in the meantime. • NRC 2010. “Hidden Costs of Energy: Unpriced Consequences of Energy Production and Use”. National Research Council of the National Academies, Washington, DC. Available from National Academies Press. • http://www.nap.edu/catalog.php?record_id=12794 • Rabl A, J. V. Spadaro & B. van der Zwaan 2005. “Uncertainty of Pollution Damage Cost Estimates: to What Extent does it Matter?”. Environmental Science & Technology, vol.39(2), 399-408 (2005). • Rabl A, Spadaro JV and Zoughaib A. 2008. “Environmental Impacts and Costs of Municipal Solid Waste: A Comparison of Landfill and Incineration”. Waste Management & Research, vol.26, 147-162 (2008). • Spadaro JV & A Rabl 2008. “Estimating the Uncertainty of Damage Costs of Pollution: a Simple Transparent Method and Typical Results”. Environmental Impact Assessment Review, vol. 28 (2), 166–183. • Rabl A, J. V. Spadaro, M. Holland. 2013. How Much is Clean Air Worth: Calculating the Benefits of Pollution Control. Cambridge University Press, in press. References Software EcoSense = software of ExternE for detailed site-specific calculations. Available at http://www.externe.info RiskPoll = software for simplified calculation of typical impacts and damage costs. Available at http://www.arirabl.org