Download
1 / 33
330 likes | 468 Views
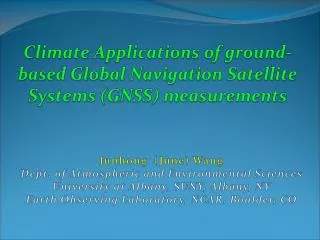
Climate Applications of ground-based Global Navigation Satellite Systems (GNSS ) measurements. Junhong (June) Wang Dept. of Atmospheric and Environmental Sciences University at Albany, SUNY, Albany, NY Earth Observing Laboratory, NCAR, Boulder, CO. Outline. Motivation

E N D
Climate Applications of ground-based Global Navigation Satellite Systems (GNSS) measurements Junhong (June) Wang Dept. of Atmospheric and Environmental Sciences University at Albany, SUNY, Albany, NY Earth Observing Laboratory, NCAR, Boulder, CO
Outline • Motivation • GNSS precipitable water (PW) data • Climate applications: • Validations of radiosonde and other data • PW Variabilities: Diurnal cycle, annual anomaly, inter-annual variability, long-term trends and extremes • 4. Other water cycle products from GNSS & other geodetic techniques • 5. Summary
Challenge: Large variability Gaffen et al. (1995)
How does GNSS estimate precipitable water? Total delay = Ionosphere + dry + wet Dual-frequency GNSS mea.: GNSS Ephemeris Station position Timing Forward model Geodetic Noise to Meteorological signals Meteorological data (Ps, Ts) & estimated Tm Atmospheric delay (ZTD = ZHD+ZWD) Precipitable Water (PW) ZWD = ZTD - ZHD ZHD = f(Ps) PW = * ZWD = f (Tm)
Why GNSS for Climate Research? • Diurnal variation • Climate extremes Validations of other measurements Climate trends
Number of GNSS Satellites GNSS Satellites & Network Expansion
Howgoodare GNSS measurements? Orbit Accuracyof GPS Satellites: ~2 cm 1994 2012
Jan. 1995 to Dec. 2012 • 2 hourly (0100, 0300, …, 2300 UTC) • 380 IGS, 169 SuomiNet, 1223 GEONET • Accuracy: < 3 mm • Ps, Tm, ZHD and ZWD also available • http://dss.ucar.edu/datasets/ds721.1/ NCAR global, 2-hourly GNSS-PW data (1995-present) Wang et al. (2007)
Hurricane Ernesto (24 Aug – 1 Sep. 2006)
Capacitive Carbon hygristor Goldbeater’s skin median -1.67 1.97 0.81 S.D. 1.72 4.15 1.93 Radiosonde validation: Systematic errors Wang and Zhang (2008a)
Temporal inhomogeneity of radiosonde PW data carbon hygristor capacitive with cover capacitive carbon hygristor Goldbeater’s skin Carbon hygristor Miami, U.S.A Suwon-Shi, Korea Relative PW differences (% Radiosonde-GPS) Beijing, China Wang and Zhang (2008)
Diurnal Variations (Lindenberg) GNSS Radiosonde before corr. Radiosonde after corr. Japanese Reanalysis ERA-Interim Vaisala RS92 Wang et al. (2013)
Global PW diurnal anomaly from GNSS Globe S. H. N. H. • The diurnal cycle is less than 5% of annual mean PW • Larger magnitude in summer than in winter • Peak around late afternoon to early evening • An order of magnitude smaller than seasonal variation
PW Anomaly in 2010 (GPS v.s. Microwave satellite) Mears et al. (2010) Mears et al. (2011) Mears et al. (2011)
Inter-annual and Long-Term PW Variability Land El Nino Ocean La Nina Mears et al. (2012)
Variations of PW with Ts, Tmax and Tmin Clausius-Clapeyron
2013 CO Flooding SA62 Akronarpt (P044) PLATTEVILLE (PLTC) ALTERNATE MASTER (AMC2)
Tropical Strom Fay, Aug 17-29, 2008 • Fatalities: 13 dir./23 indirect • $560 million • Area affected: Puerto Rico, Dominican Republic, Haiti, Jamaica, Cuba, Bahamas, South Eastern US Fay Dumps Record-Breaking Rain; Flood Victims Warned Of Alligator Swimming In Streets Homeowners Forced To Use Canoes POSTED: August 20, 2008
Tropical Strom Fay, Aug 17-29, 2008 http://xenon.colorado.edu/spotlight/index.php?product=spotlight&station=sg05
Reflected GPS Signals http://xenon.colorado.edu/portal/
2012 Anomaly NMRI: Vegetation Water Content NDVI: photosynthesis NLDAS: precipitation PW: Water Vapor
Soil Moisture Variability at Marshall, CO http://xenon.colorado.edu/portal/index.php
DORIS (Doppler Orbitography and Radiopositioning Integrated by Satellite)
Summary The ground-based GNSS PW data have been approved very useful for studying water vapor diurnal, inter-annual and long-term variations, and extreme events, and play an important role in various climate studies. Other potential applications and other techniques of GNSS measurements to climate should be explored, GPS-RO, 3-D water vapor retrieval, other geodetic techniques. http://www.eol.ucar.edu/homes/junhong/homepage.htm http://xenon.colorado.edu/portal/