Download
1 / 14
140 likes | 282 Views
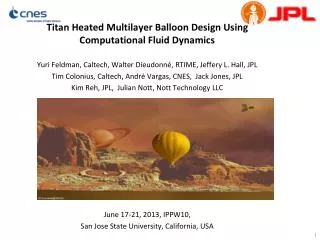
Titan Montgolfiere Balloon Analysis and Design Using Computational Fluid Dynamics Simulations. Jeffery L. Hall, JPL/Caltech Andre Vargas, CNES Tim Colonius, Caltech Walter Dieudonne, RTIME Yuri Feldman, Caltech Jack Jones, JPL/Caltech Kim Reh, JPL/Caltech Julian Nott, Nott Technology LLC.

E N D
Titan Montgolfiere Balloon Analysis and Design Using Computational Fluid Dynamics Simulations Jeffery L. Hall, JPL/Caltech Andre Vargas, CNES Tim Colonius, Caltech Walter Dieudonne, RTIME Yuri Feldman, Caltech Jack Jones, JPL/Caltech Kim Reh, JPL/Caltech Julian Nott, Nott Technology LLC June 19, 2012
Introduction • Balloon concepts for Saturn’s moon Titan date back at least to the mid-1970s. • The Cassini-Huygens mission greatly accelerated concept and technology development. • Wonderful discoveries showed Titan to be a world with lakes, dry river valleys, dune fields, methane rain, etc. • There is tremendous interest in a future mission to go back to Titan and conduct further scientific investigations using a mobile balloon platform. • Titan’s high atmospheric density and cryogenic temperatures enable both hot air and light gas balloons of modest size. • The 2013-2023 Decadal Survey for Planetary Science recommends technology development for Titan balloons.
Introduction (cont.) • JPL and CNES began a collaboration on Titan balloon technology development in January of 2010. • The collaboration includes participation by Caltech on the US side and RTIME on the French side. • Much of the collaboration has consisted of the development and use of computational fluid dynamics (CFD) models of the Titan Montgolfiere (hot air ) balloon. • This presentation gives a brief overview of recent results. • More details can be found in the paper. • The work is based on three key foundational elements: • Turbulence-based fluid dynamics models. • Validation with cryogenic test data on small scale (1 m) balloons. • Multiple fluid dynamics models of varying sophistication and cross-checking between the Caltech/JPL and RTIME/CNES researchers. • The presentation concludes with a description of the Titan Montgolfiere balloon design space (payload vs size vs heat input) based on the latest CFD results.
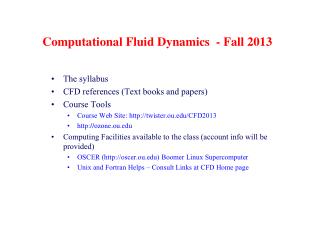
Montgolfiere Balloons Schematic of double-walled Titan Montgolfiere (hot air) balloon. • A hot air (Montgolfiere) balloon uses heated ambient atmosphere to generate buoyancy. • At Titan, the balloon uses waste heat from a radioisotope power source. • There are two great advantages of a Montgolfiere balloon for Titan: • Insensitive to pinholes (already vented to the atmosphere). • Easy and repeatable altitude control via gas venting through a valve at the apex. • The leading Titan design features a double balloon wall with the annular gap providing an insulating function that increases gas temperature and hence buoyancy (at right). • The 2008 TSSM Flagship mission study was based on this kind of balloon.
Prediction methods • The JPL/Caltech and CNES/RTIME groups have used all four main prediction/estimation techniques for the Titan Montgolfiere Balloon: • Engineering correlations • Semi-analytical correlations for convective heat transfer around/between uniform temperature spheres • Reynolds-averaged Navier-Stokes (RANS) • Averages out and models all intrinsic turbulence space/time scales • Large-eddy Simulation (LES) • Spatially filter out/supply model for the small scales • Direct Numerical Simulation (DNS) • Directly resolve all scales • All require experimental validation (see next slide). Uncertainty Computational Expense
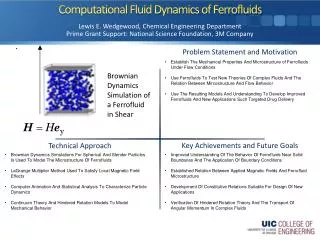
Cryogenic Balloon Tests Single wall balloon in chamber prior to test • JPL conducted cryogenic experiments on a two 1-meter diameter balloons at a Wyle Laboratories in April 2011. • The main purpose was to get data to validate the CFD models for single and double wall designs. • Both balloons had 4 thermocouples embedded in a gore. • The double wall balloon had a 5 cm gap and one transparent gore to enable verification of gap inflation. • Environment temperatures: 190, 140 and 90 K. • Heat input levels: 100, 250, 400, 550 and 700 Watts (not all levels used for each balloon and each thermal environment). • Load cell with 1.0 kg range used for measuring lift.
Flow topology Because of the heat source, a thermal plume is created and entrains the flow forming a large recirculation zone. In the gap, the flow recirculates downward along the cool external gap side and upward along the warm internal gap side. On top in the gap a counter-rotating vortex is created due to the hot internal plume local over-heating.
Ground tests, CFD results CFD results based on spheres agree well with experimental results for both the single and double wall cases.
Shape effect Heat source location, fromleft to right: lowest (baseline), central, highest Buoyant mass for the real shape. Spherical buoyant mass = 761 [g]. In the early CFD work, the balloon shape was assumed to be spherical for simplicity. But the actual balloon is teardrop-shaped. The balloon shape was reconstructed from photographs and new CFD simulations performed to assess the impact of the real shape. Real shape simulations showed that the buoyancy varies little (3%): the spherical model assumption in the engineering model is okay. Other tests with varying heat source locations show that the best buoyancy is obtained for the lowest located heat source as it generates the most uniform internal flow.
CFD, sphere vs real shape Velocity Velocity Temperature Temperature Comparison of temperature and velocity flow fields for the real and idealized double wall balloons.
Buoyancy Scaling Full scale double-walled 2-wall Engineering correlation Titan Sky simulator Full scale single-walled Scaled single- and double-walled CFD result Experimental result
CFD Implications for Full Scale Balloon Design • The CFD-indicated performance of the gap insulation has been used to update the predictions of full scale balloon design. • The overall parameter space was explored with a simplified 1D engineering correlation model that uses gap heat transfer based on the CFD results. • Three different balloon diameters analyzed (12, 13 and 14 m). • Three different heating levels: 630, 1088 and 1740 W. • 630 W corresponds to 2 ASRGs after 15 years. • 1088 W corresponds to a “5 plutonium brick” source after 15 years. • 1740 W corresponds to an MMRTG source after 15 years. (The TSSM heat source.) • The results are graphically shown on the next slide.
Titan Montgolfiere Design Curves TSSM 1740W 1088W 630W • The altitude dependence is weak, the size dependence a little more significant. • Note that the TSSM design called for a 10.6 m diameter balloon at 8 km altitude and had ~220 kg of non-balloon lift mass with 1740 W. • The new analysis shows that a ~12 m balloon is now needed to lift this mass. • This kind of lift mass is not achievable with a 630 W input, but might be achievable with an hypothetical intermediate size (e.g. 1088 W) and a balloon size of ~16 m (extrapolating the trend).
Conclusions • Selected results have been presented for a series of numerical calculations predicting the performance of Titan Montgolfiere (hot air) balloons. • Turbulent CFD models were validated with cryogenic experiment data from small, 1 m scale balloons. • Multiple analysis techniques confirm that prior engineering correlation models overestimated insulating effect of a double-wall balloon. • Balloon diameters must grow by 10-20% to compensate for this. • Result shows the value of performing detailed CFD analysis. • Design curves were presented to guide future efforts to scope a Titan balloon mission. • Many more technical details and results are contained in the written paper.