Download

1 / 53
550 likes | 621 Views
Learn about key performance metrics, capacity planning, system testing, and monitoring strategies for optimizing Enterprise GIS efficiency and scalability. Explore tools, methodologies, and best practices to ensure smooth system operation.

E N D
Enterprise GIS: Performance and Scalability Andrew Sakowicz, asakowicz@esri.com Frank Pizzi, fpizzi@esri.com
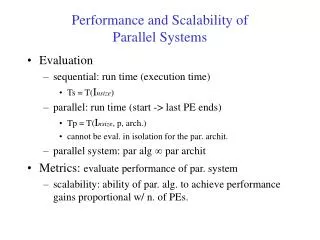
Performance Speed, e.g. response time (seconds)
Scalability The ability to increase output and maintain acceptable performance
Capacity The maximum level of output the system can produce, e.g. X cars/sec X maps/sec At capacity Over capacity
Bottleneck Resource(s) limiting the performance or capacity Not bottleneck bottleneck Think of : Lanes -as CPU processor Toll -as ArcGIS Server instances Cars -as map requests
Capacity User load Throughput(req/hr) CPU Utilization (%) Network used (Mbps) Response Time (sec) Capacity (~ 85% utilization) Memory used (Mb) Content length (bytes) Time
Process and Tools Type Presentation Title Here
System Tools overview http://www.arcgis.com owner:EnterpriseImp Show ArcGIS Desktop Content
System Tools framework System Tools are not just tools
Provide sufficient hardware resources Most systems are CPU bound Most well-configured and tuned GIS systems are CPU bound. GIS Systems are bound by: • CPU - typically • Memory – when large number of services • Disk – Image Service, Synchronization • Network – low bandwidth deployment • Poorly configured virtualization can result in 30% or higher performance degradation
Infrastructure Memory requirements Wide ranges of memory consumptions
Infrastructure Hyper threading does not double throughput System Test case: 4 physical, 8 logical core
System Designer Solution Architecture design methodology Gathering requirements Designing Capacity: CPU, Network, Memory Reporting
Demo System Designer
Testing Objectives Meet Service-Level Agreement (SLA) Bottlenecks analysis Capacity planning Benchmarking different alternatives
Required skill set Configuration, Tuning, Testing
Browser Total Response Time (t1-t2) Web Server Wait Time ArcGIS Server Usage Time ArcSOC Search & Retrieval Time ArcSDE/DBMS Tuning methodology Profile each tier starting from the top t2 t1
Fiddler Fiddler measurement approximately 5.2 seconds
ArcGIS Server 10.3.1 Statistics http://server.arcgis.com/en/server/latest/administer/windows/about-server-statistics.htm Total requests Average response time Maximum response time Timeouts Maximum running instances 30 min resolution reports
ArcGIS Server Logs http://www.arcgis.com/home/item.html?id=90134fb0f1c148a48c65319287dde2f7
System Monitor –ArcGIS Server Statistics • https://systemmonitoring-emcs.esri.com/#/arcgis/ESLSRV12 • User: esridemo • Password: esridemo
Mxdperfstat http://www.arcgis.com/home/item.html?id=a269d03aa1c840638680e2902dadecac
Oracle Trace Compare elapsed time Elapsed time slightly changed due to different test runs
Oracle Execution plan Inefficient spatial index
System Test Tool features GIS Test Automation ArcGIS Services Mapping Feature Service OGC Geocoding Image Service Network Analyst Geoprocessing Tile Cache Application Testing Discipline relevant report
Test tools feature comparison Tech Support by Esri PS as part of consulting support
Performance testing Value Identify bottlenecks Determine system capacity Demonstrate performance SLA
Demo System Test
Monitoring Enterprise GIS Challenges Multiple administrators Multiple disparate monitoring/diagnostic tools Data collected in a reactive fashion: on demand and for limited time Correlation of data with different timestamp is difficult ArcGIS administrators do not have access to all tools, data and reports Challenging to quickly identify the root cause and take appropriate measures
Standards for effective GIS monitoring • Many excellent monitoring tools on the market • Few provide GIS dashboards • System Monitor can be used as reference implementation
Enterprise GIS effective monitoring “PIECE” of mind with System Monitor Proactive Integrated Dashboards across all tiers End-to-End All tier monitoring Continuous %Coverage provided Extendable Custom queries
Monitoring Value Proactive validation:
Demohttps://systemmonitoring-emcs.esri.com/Portaluser: esridemopassword: esridemo
Use Cases Applied use of System Monitor and Test tools
Demo Simulate CPU spike (e.g. Antivirus scan)
Demo Simulate ArcGIS user load
Demo Intermittent slow performance: Networks latency (SM extensions) https://systemmonitoring-emcs.esri.com/#/url/eslsrv12_6080_arcgisoutput_1mb_file
Demo ArcGIS Server services stopped
Demo ArcGIS Server service usage https://systemmonitoring-emcs.esri.com/apps/dashboard_sample/#/ArcGIS
Demo Unbalanced resources: ArcGIS Server clusters https://systemmonitoring-emcs.esri.com/apps/dashboard_sample/#/ArcGISConfig
Demo ArcGIS Server slow services https://systemmonitoring-emcs.esri.com/apps/dashboard_sample/#/ArcGIS
Demo ArcGIS Server service usage https://systemmonitoring-emcs.esri.com/apps/dashboard_sample/#/ArcGIStuning