Download
1 / 70
700 likes | 709 Views
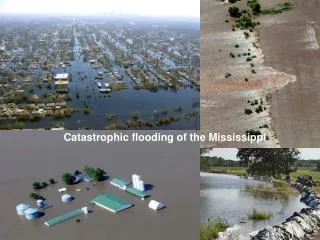
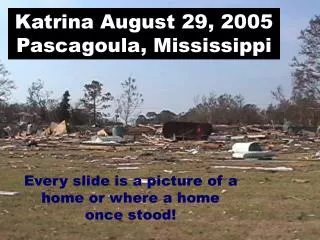
This article discusses the catastrophic losses experienced in Mississippi after Hurricane Katrina, highlighting the impact on the state's population and property. It examines the insured losses, major storms, and the progress of settling insurance claims.

E N D
Catastrophic Loss in MississippiThe Aftermath of Katrina Ole Miss Insurance Symposium University of Mississippi Oxford, MS March 26, 2008 Robert P. Hartwig, Ph.D., CPCU, President Insurance Information Institute 110 William Street New York, NY 10038 Tel: (212) 346-5520 Fax: (212) 732-1916 bobh@iii.org www.iii.org
CATASTROPHE LOSS REVIEW A Decade of Disaster, With Mississippi in the Crosshairs
Most of US Population & Property Has Major CAT Exposure Is Anyplace Safe? Source: RMS
U.S. Insured Catastrophe Losses* $ Billions $100 Billion CAT year is coming soon 2006/07 were welcome respites. 2005 was by far the worst year ever for insured catastrophe losses in the US, but the worst has yet to come. *Excludes $4B-$6b offshore energy losses from Hurricanes Katrina & Rita. Note: 2001 figure includes $20.3B for 9/11 losses reported through 12/31/01. Includes only business and personal property claims, business interruption and auto claims. Non-prop/BI losses = $12.2B. Source: Property Claims Service/ISO; Insurance Information Institute
States With Largest Insured Catastrophe Losses in 2007 2007 CAT STATS • 1.18 million CAT claims across 41 states arising • 23 catastrophic events Source: PCS/ISO; Insurance Information Institute.
Distribution of 2007 US CAT Losses, by Type and Insured Loss $ Billions Personal (home, condo, rental, contents etc.) accounted for 68% of all US insured CAT losses paid in 2007. CAT claim count was 1.18 million. Source: PCS division of ISO.
Distribution of 2007 US CAT Losses, by Type and Claim Count Thousands of Claims Personal (home, condo, rental, contents etc.) accounted for 61% of all US insured CAT claims in 2007, but 68% of loss dollars paid. Source: PCS division of ISO.
Top Catastrophic Wildland Fires In The United States, 1970-2007 Insured Losses (Millions 2007 $) Fourteen of the top 17 catastrophic wildfires since 1970 occurred in California *Estimate from CA Insurance Dept., Jan. 10, 2008. Source: ISO's Property Claim Services Unit; California Department of Insurance; Insurance Information Institute.
Inflation-Adjusted U.S. Insured Catastrophe Losses By Cause of Loss, 1987-2006¹ Insured disaster losses totaled $297.3 billion from 1987-2006 (in 2006 dollars). Wildfires accounted for approximately $6.6 billion of these—2.2% of the total. 1 Catastrophes are all events causing direct insured losses to property of $25 million or more in 2006 dollars. Catastrophe threshold changed from $5 million to $25 million beginning in 1997. Adjusted for inflation by the III. 2 Excludes snow. 3 Includes hurricanes and tropical storms. 4 Includes other geologic events such as volcanic eruptions and other earth movement. 5 Does not include flood damage covered by the federally administered National Flood Insurance Program. 6 Includes wildland fires. Source: Insurance Services Office (ISO)..
Global Insured Catastrophe Losses by Region, 2001-2007 $ Billions North America accounted for 70% of global catastrophe losses 2001-2007 Notes: 2001-03 figures for N. America include US only. 2001 figure includes only property losses from 9/11. Source: Insurance Information Institute compiled from Swiss Re sigma issues.
Top 10 Most Costly Hurricanes in US History, (Insured Losses, $2005) Seven of the 10 most expensive hurricanes in US history occurred in the 14 months from Aug. 2004 – Oct. 2005: Katrina, Rita, Wilma, Charley, Ivan, Frances & Jeanne Sources: ISO/PCS; Insurance Information Institute.
Insured Loss & Claim Count for Major Storms of 2005* Hurricanes Katrina, Rita, Wilma & Dennis produced a record 3.3 million claims *Property and business interruption losses only. Excludes offshore energy & marine losses. Source: ISO/PCS as of June 8, 2006; Insurance Information Institute.
Hurricane Katrina Claim Status on Storm’s 1st Anniversary* 95% of the 1.2 million homeowners insurance claims in Louisiana & Mississippi are settled, with just 2% in dispute *Hurricane Katrina made its north Gulf coast landfall August 29, 2005. Source: Insurance Information Institute survey, August 2006.
Hurricane Katrina Claim Status on Storm’s 2nd Anniversary* 99% of the 1.2 million homeowners insurance claims in Louisiana & Mississippi were settled as of the storm’s second anniversary in 2007 *Hurricane Katrina made its north Gulf coast landfall August 29, 2005. **Unsettled implies that the claim is in the process of settlement, involved in mediation or litigated. Source: Insurance Information Institute survey, August 2007.
Hurricane Katrina Insured Loss Distribution by State ($ Millions)* Mississippi accounted for 33.5% of the insured losses paid and 29.5% of the claims filed Total Insured Losses = $40.579 Billion *As of June 8, 2006 Source: PCS division of ISO.
Hurricane Katrina Claim Count Distribution by State* MS accounted for 33.5% of the insured losses paid and 29.5% of the claims filed Total # Claims = 1,743,800 *As of June 8, 2006 Source: PCS division of ISO.
Hurricane Katrina Loss Distribution by Line ($ Millions)* Total insured losses are estimated at $40.579 billion from 1.7438 million claims. Excludes $2-$3B in offshore energy losses Katrina had a disproportionate impact on businesses, decimating the economy and making recovery more difficult *As of June 8, 2006 Source: PCS division of ISO.
Mississippi: Katrina Loss Distribution by Line ($ Millions)* Mississippi insured losses are estimated at $13.6 billion from 515,000 claims. Excludes $2-$3B in offshore energy losses *As of June 8, 2006 Source: PCS division of ISO.
Mississippi: Katrina Claim Count Distribution by Line* Commercial (business) claims accounted for 11% of the claims filed but 55% of the insured losses. Homeowners claims accounted for 69% of claims and 40% of losses. *As of June 8, 2006 Source: PCS division of ISO.
MS: Average Cost per Claim by Type of Claim* Commercial (business) claims were 9-10 times more expensive than homeowners claims on average for Hurricane Katrina, but accounted for just 11% of the total number of claims *As of June 8, 2006 Source: PCS division of ISO.
Growth in Mississippi Construction Component of GDP Pre/Post-Katrina Insurance dollars helped construction spending surge in MS Sources: US Bureau of Economic Analysis; Insurance Information Inst.
Mississippi Windstorm Plan:Exposure to Loss ($ Mill) Total exposure to loss in the Mississippi Windstorm Underwriting Association (MWUA) jumped to $5.4 billion in 2006 from $1.9 billion in 2005, an increase of 187%. The total number of policies in the Plan more than doubled between 2005 and 2006. Source: PIPSO; Insurance Information Institute
Louisiana: Katrina Loss Distribution by Line ($ Millions)* Louisiana insured losses are estimated at $25.275 billion from 975,000 claims. Excludes $2-$3B in offshore energy losses *As of June 8, 2006 Source: PCS division of ISO.
Hurricane Rita Claim Count Distribution by State* Mississippi accounted for 1.8% of the insured losses on 7,000 claims. Excludes offshore energy losses of $2-3B Total # Claims = 383,000 *As of June 8, 2006 Source: PCS division of ISO.
Hurricane Rita Loss Distribution, by Line ($ Millions)* Total insured losses are estimated at $5.0 billion (excl. offshore energy of $2-$3B) from 383,000 claims. *As of June 8, 2006 Source: PCS division of ISO.
Louisiana: Rita Loss Distribution, by Line ($ Millions)* Total insured losses are estimated at $2.9125 billion from 185,000 claims. *As of June 8, 2006 Source: PCS division of ISO.
Katrina’s Path of Destruction Through the Offshore Energy Industry Katrina (& Rita) tore through offshore facilities Source: “Hurricane Katrina: Profile of a Super Cat,” RMS, October 2005.
Insured Offshore Energy Losses for Recent Major Gulf Storms Hurricanes Katrina, Rita and Ivan cost energy insurers at least $7 billion Sources: Insurance Information Institute research estimates. *Midpoint of estimated range for $2.0 to $2.5 billion)
HURRICANES: INSURED LOSS POTENTIAL Katrina:Just the Beginning?
Total Value of Insured Coastal Exposure (2004, $ Billions) Mississippi had $45 billion in insured coastal property exposure in 2004 compared to $209 billion in Louisiana and nearly $2 trillion in Florida Source: AIR Worldwide
Value of Insured Residential Coastal Exposure (2004, $ Billions) Mississippi had $21 billion in insured residential coastal property exposure in 2004 (47% of all MS coastal exposure) Source: AIR
Value of Insured Commercial Coastal Exposure (2004, $ Billions) Mississippi had $24 billion in insured commercial coastal property exposure in 2004 (53% of all MS coastal exposure) Source: AIR
Insured Coastal Exposure as a % of Statewide Insured Exposure (2004, $ Billions) Mississippi coastal exposure accounts for 13.5% of all insured exposure statewide Source: AIR Worldwide
Historical Hurricane Strikes in Hancock County, MS, 1900-2007 Population of Hancock County has soared (4-fold since 1950) as has its vulnerability Source: NOAA Coastal Services Center, http://maps.csc.noaa.gov/hurricanes/pop.jsp; Insurance Info. Institute.
Historical Hurricane Strikes in Harrison County, MS, 1900-2007 Population of Harrison County has soared (4-fold since 1940) as has its vulnerability Source: NOAA Coastal Services Center, http://maps.csc.noaa.gov/hurricanes/pop.jsp; Insurance Info. Institute.
Historical Hurricane Strikes in Jackson County, MS, 1900-2007 Population of Jackson County has soared (4-fold since 1950) as has its vulnerability Source: NOAA Coastal Services Center, http://maps.csc.noaa.gov/hurricanes/pop.jsp; Insurance Info. Institute.
2005 Was a Busy, Destructive, Deadly & Expensive Hurricane Season All 21 names were used for the first time ever, so Greek letters were used for the final storms 2005 set a new record for the number of hurricanes & tropical storms at 28, breaking the old record set in 1933. Source: WeatherUnderground.com, January 18, 2006.
2007 Hurricane Season:No Big Hits Once Again A Sigh of Relief The 2007 season saw 15 named storms (same as devastating 2004 season) including two rare Category 5 storms, but the US escaped this year with very little loss Source: www.wunderground.com, accessed 1/11/08; Insurance Information Institute
Outlook for 2008 Hurricane Season: 25% Worse Than Average *Average over the period 1950-2000. Source: Philip Klotzbach and Dr. William Gray, Colorado State University, December 7, 2007.
Landfall Probabilities for 2008 Hurricane Season: Above Average *Average over the past century. Source: Philip Klotzbach and Dr. William Gray, Colorado State University, December 7, 2007.
Mississippi InsuranceMarket Facts • MS P/C insurance premium volume in 2005 was $3.76 billion, or 0.8% of the US total of $478.5 billion • LA Homeowners insurance premium volume in 2005 was $580 million, or 1.0% of the US total of $57.5 bill. • Insured Katrina & Rita homeowners losses of $5.5 billion in MS were more than 9 times the 2005 homeowners premiums of $580 million • The 2005 hurricane losses in MS homeowners insurance wiped out 17 years of premium and every dollar of profit ever made in the history of the state in this line Source: Insurance Information Inst. from National Underwriter Highline annual statement database; PCS.
Mississippi & Louisiana Market Shares, All Lines & Homeowners ALL LINES ($ Billions) HOMEOWNERS ($ Millions) MS accounts for less than 1% of the US insurance market but 34% of 2005 hurricane losses Source: Insurance Information Institute from National Underwriter Highline annual statement database.
Source: NAIC, Insurance Information Institute Average Expenditures on Home Insurance, 2005 vs. 1997 +102.1% +67.9% +60.5% +71.8% +68.3% +71.8%
*Latest available from NAIC. Source: NAIC, Insurance Information Institute Average Expenditures on HO Insurance, LA vs. U.S., 1997-2004* Change: 1997-2004* Louisiana: +61.3% US: +60.2%
ACTS OF GOD & THE BOTTOM (AND TOP) LINESCatastrophic Loss & Insurer Financial Performance
ROE: P/C vs. All Industries 1987–2008E P/C profitability is cyclical, volatile and vulnerable Sept. 11 Hugo Katrina, Rita, Wilma Lowest CAT losses in 15 years Andrew Northridge 4 Hurricanes *2007 is actual 9-month ROAS of 13.1%. 2008 P/C insurer ROE is I.I.I. estimate. Source: Insurance Information Institute; Fortune
Strength of Recent Hard Markets by NWP Growth* 1975-78 1984-87 2001-04 Post-Katrina period resembles 1993-97 (post-Andrew) 2008: Projected -0.3% premium growth would be the first decline since 1943 Note: Shaded areas denote hard market periods. Source: A.M. Best, Insurance Information Institute *2007 figure is actual 9-month figure.