Download
1 / 14
140 likes | 174 Views
Dive into the ramifications of global imbalances post-financial crisis and strategies for adjustment. Explore data on current account balances, savings, investment, and more. Discover forecasted trends and necessary adjustments for a balanced global economy at the University of Western Australia conference.

E N D
Global Imbalances: How much adjustment will we see? In The Zone Conference – University of Western Australia 9 November 2009 David Gruen Executive Director, Macroeconomic Group
Global Imbalances • Implicated in the global financial crisis • Desirable that they become much smaller
Current Account BalancesPer cent of world GDP Source: IMF WEO Database, Treasury.
Global Imbalances • Can examine from the perspective of trade imbalances (exports and imports) and net foreign income flows • Or national saving and investment – a more fundamental perspective
Savings and Investment – ChinaPer cent of GDP Source: CEIC China Database, IMF WEO Database, Treasury.
Savings and Investment – Other East AsiaPer cent of GDP Note: Excludes Taiwan and Vietnam due to data limitations. Source: IMF WEO Database, Treasury, World Development Indicators.
Capital Flows into Developing AsiaPer cent of GDP Source: IMF WEO Database.
Savings and Investment – USPer cent of GDP Source: IMF WEO Database.
Savings and Investment – Australia Per cent of GDP Source: ABS 5206.0, ABS 5302.0, Treasury.
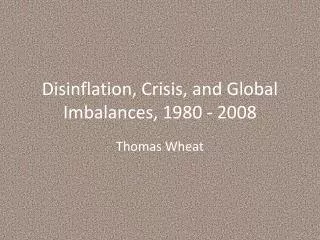
Per cent Per cent 75 75 70 70 US 65 65 60 60 55 55 50 50 45 45 40 40 35 35 Sep-79 Sep-82 Sep-85 Sep-88 Sep-91 Sep-94 Sep-97 Sep-00 Sep-03 Sep-06 Sep-09 Household ConsumptionPer cent of GDP Source: Australian Bureau of Statistics, Bureau of Economic Analysis, CEIC China Database.
Household ConsumptionPer cent of GDP Per cent Per cent 75 75 70 70 US 65 65 Australia 60 60 55 55 50 50 45 45 40 40 35 35 Sep-79 Sep-82 Sep-85 Sep-88 Sep-91 Sep-94 Sep-97 Sep-00 Sep-03 Sep-06 Sep-09 Source: Australian Bureau of Statistics, Bureau of Economic Analysis, CEIC China Database.
Household ConsumptionPer cent of GDP Source: Australian Bureau of Statistics, Bureau of Economic Analysis, CEIC China Database.
Real Effective Exchange Rates2005 = 100, monthly Source: Bank of International Settlements.
Global Imbalances: Conclusions • Current forecasts suggest imbalances will become somewhat smaller • Further adjustment will require: • a sustained rise in US national saving • a sustained rise in domestically sourced growth in Asia • further adjustment of real exchange rates