Download
1 / 27
270 likes | 494 Views
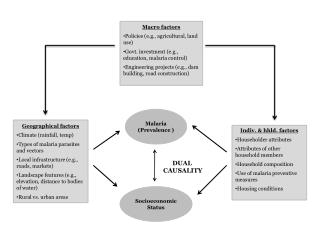
Phase 5 Agricultural Land Use. November 9, 2004 Sara Brandt Chesapeake Research Consortium Chesapeake Bay Program. Three sources of Land Use Data. RESAC Land Use 2000 only Agricultural Census Available for 1982, 1987, 1992, 1997, 2002 Urban Hindcast Available for 1990 and 2000.

E N D
Phase 5 Agricultural Land Use November 9, 2004 Sara Brandt Chesapeake Research Consortium Chesapeake Bay Program
Three sources of Land Use Data • RESAC Land Use • 2000 only • Agricultural Census • Available for 1982, 1987, 1992, 1997, 2002 • Urban Hindcast • Available for 1990 and 2000
High Density Pervious Urban High Density Impervious Urban Low Density Pervious Urban Low Density Impervious Urban Alfalfa Nursery Pasture Hay with Nutrients Hay without Nutrients Composite Crop with Manure (high and low till) Composite Crop without Manure Extractive Barren Mixed Forest Deciduous Forest Evergreen Forest Natural Grass Water Final Land Use Categories
Phase 5 Ag Land Use Categories • Pasture • Nursery • Alfalfa • Hay w/o Nutrients = Wild Hay + Orchards + Idle Cropland + Fallow Cropland • Hay with Nutrients = Total Hay – Wild Hay - Alfalfa + Failed Cropland
Phase 5 Ag Land Use Categories • Composite Crop without Manure = Cotton + Tobacco + Vegetables + White Potatoes + Sweet Potatoes + Berries • Composite Crop with Manure = Total Corn + Soybeans + Small Grains + Total Sorghum + Dry Edible Beans
Ag Census Data • Ag Census Data is used to increase the accuracy of RESAC Ag and to determine acreage of Phase 5 Ag categories. • Ag Census Data available on a county scale for years 1982, 1987, 1992, 1997, and 2002.
Ag Census Data Gaps • Crop data in a county may be omitted due to a limited number of farms reporting the item or to avoid disclosing information about individual farms. • To estimate data gaps, the difference between the State Total acres and the sum of the county acres was distributed to the counties with omitted data in proportion to their average crop acreage.
Pasture Corn Hay Make up 72% of Total Agriculture in Bay watershed and S. Virginia Crops in which data gaps exist in <5% of counties in Ag Census:
Tobacco Peanuts Sweet Potatoes Rye Popcorn Sunflower Triticale Sorghum Dry Beans Cotton Make up 1% of Total Agriculture in Bay watershed and S. Virginia Crops in which data gaps exist in >50 % of counties in Ag Census:
Doublecropping • Many farms in this region practice a two year corn-wheat-soybean crop rotation. • In calculating the Composite Crop with Manure, a simple summation of corn, wheat, soybeans, and dry beans would double count crops in this crop rotation. • Composite Crop with Manure was calculated as the difference between the Total Cropland and the sum of all other non-doublecropped cropland.
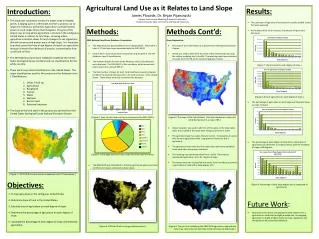
RESAC and Census Ag Estimates • 25% mean difference, varies widely between counties • Large difference in VA may be driven by lack of data in So VA 14%
Incorporating Ag Census into 2000 RESAC • Ag Census is interpolated to 1990 and 2000 • RESAC Ag category is replaced by Total Ag from Ag Census • In order to keep the total county area fixed, all other RESAC land use categories are adjusted proportionally to the probability that they have been spectrally confused with Ag land, as determined by Edge Analysis.
Edge Analysis • Inaccuracies in RESAC arise from spectral confusion around the edges, where one land use class borders another. • For each county, a 60 meter buffer determined the acreage of each land use around the edges of Agricultural areas. • Proportional acreage of each land use surrounding Ag areas represents the probability that Ag will be spectrally confused with that land use. • Spatially explicit measure of land use class confusion
Ag Census 2000 Must subtract 1000 acres to keep total area fixed
1990 Land Use • Do not have a reliable 1990 RESAC product • 1990 Urban derived from impervious and census data • 1990 Ag area from interpolation of Ag Census • Remaining county area distributed to other land cover classes proportional to 2000 RESAC
All other years • Do not have a RESAC product • Urban derived from interpolation of 1990 and 2000 urban • Ag area from Ag Census • Remaining county area distributed to other land cover classes proportional to 2000 RESAC
Fudging it in Southern VA • MLRC 2000 and NLCD 1992 used to fill in where RESAC was not available • Urban Hindcast not available in S. VA, NC, or TN • Total urban from MRLC/NLCD data parsed into pervious/impervious and high/low intensity development based on watershed average ratio
RESAC coverage area NLCD 1992 MLRC 2000
14% decrease in Ag (3.5% watershed area) • 57% increase in Urban (3% watershed area)
Change in 2002 Ag Census Methodology • 2002 Ag Census includes a “coverage adjustment” to account for under-representation of farmland in Census mailing lists • Undercoverage in the Census Mail List is estimated by independent area frame survey • Census data items are weighted based on characteristics of farms in area frame survey that are not on the Census mail list • Full documentation of Census methods available at: www.nass.usda.gov/census/census02/volume1/us/us2appxc.pdf
Change in Ag Census Methodology • Coverage adjustment in 2002 Census provides a more accurate accounting of agricultural land but cannot be compared with past Censuses • NASS provides 1997 Census with coverage adjustment for historical comparison
Overall 5% increase in Total Ag using new Census method • Differences vary widely between counties and crop type.
2002 census • Need to reconcile 2002 Census with previous Censuses. • Estimates of % of acreage not covered in Census Mail List published with each Census can be used to determine the coverage adjustment for each state.
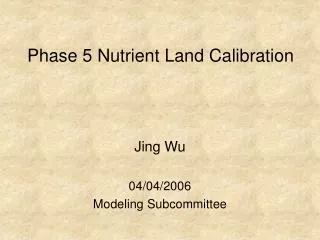
Fertilizer Application Volatilized fertilizer NH3 Fertilizer Sold NM crops w/o manure NM acres w/ manure starter fertilizer, with manure applied after Manure on NM acres Volatilized manure Acres of crop w/o manure Non-NM acres Manure Mass-balance Non-NM acres w/ all leftover fertilizer Non-NM acres w/ leftover manure