Download
1 / 46
460 likes | 483 Views
Learn about water quality trading and its benefits in improving water quality using market-based mechanisms. Explore a case study on the Bear River Watershed trading feasibility.

E N D
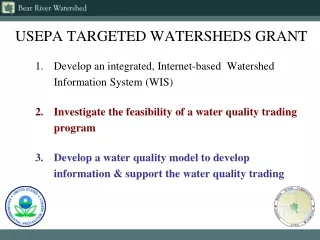
USEPA TARGETED WATERSHEDS GRANT Develop an integrated, Internet-based Watershed Information System (WIS) Investigate the feasibility of a water quality trading program Develop a water quality model to develop information & support the water quality trading
PROJECT PARTNERS USU Project Collaborators: Nancy Mesner Terry Glover David Stevens Arthur Caplan Jeff Horsburgh Bethany Neilson United States EPA Gary Kleeman Bear River Commission Jack Barnett Water Quality Task Force Mitch Poulson Wyoming DEQ Jack Smith Idaho DEQ Lynn Van Every Utah DEQ Mike Allred
WATER QUALITY TRADING (WQT) 2003 --- U.S. EPA ISSUES ITS WATER QUALITY TRADING PROGRAM THE POLICY ENABLES AND SUPPORTS THE ADOPTION OF MARKET-BASED PROGRAMS FOR IMPROVING WATER QUALITY A 1996 “DRAFT FRAMEWORK FOR WATERSHED BASED TRADING” ACTUALLY INITIATED FUNDING FOR WATER QUALITY TRADING EPA POLICY ENDORSES THE USE OF WATER QUALITY TRADING – WQT—AS A POSSIBLE MECHANISM TO IMPROVE WATER QUALIITY
WHAT IS WATER QUALITY TRADING? A market-based mechanism that allows a source facing relatively high pollution-reduction costs to compensate another source to achieve a less-costly reduction with the same or higher water-quality benefit. THE BASIC INCENTIVE FOR TRADING UNDER TMDL REGULATION Suppose Source A is required to reduce a unit of total phosphorus (TP) from the river. For whatever reason, it costs Source A $100 to reduce that unit. Source B, on the other hand, can reduce an additional unit for $80. Under WQT, there is room for Source A to pay Source B something less than $100 but more than $80 for Source B to clean up that unit of TP.
Nonpoint source WATER QUALITY IMPROVMENTS Permitted Facility point source BACKGROUND ON TRADING $$$ WQT is a tool that generally connects permitted municipal and industrial facilities as point sources with nonpoint sources, the latter primarily being agricultural producers ---- there may exist some cases of trading between nonpoint sources depending on control cost differences Point sources are permitted under the National Pollution Discharge Elimination System –NPDES---and their pollutants are regulated to be at certain levels A water quality trading market can exist only when point and nonpoint sources in a watershed have very different opportunities and costs to reduce pollutants, thereby creating a market for less-expensive approaches to improve water quality---Ag conservation being one such approach
$$$ Cost Share Programs $$$ WATER QUALITY IMPROVMENTS Investment $$$ WQT can provide an opportunity for nonpoint sources (e.g., ag producers) to receive compensation for implementing conservation practices on their lands The implementation of pollutant reduction measures in order to sell credits to permitted point sources using cost share programs depends on the trading program and/or state program rules as well as the future existence of such programs. It is therefore important that the nonpoint source managers be a part of the program development. USDAconsiders pollutant reductions via conservation as producer property. Various cost share programs exist for producers to combine with their own investment to implement Best Management Practices – BMP’s – to reduce pollutants at lower costs
BEAR RIVER WATERSHED • For the Bear River Watershed,we are assessing the feasibility of trading assuming a pre-fixed pollution target (load for a watershed) • Such a target can be set by previous policy or by a TMDL process TMDL = Total Maximum Daily Load We are currently assessing the conditions for, and feasibility of, the Bear River Watershed WQT in this watershed may be implemented as a watershed program or may be a part of statewide program ---- the program is yet to be determined
TMDL IMPLEMENTATION MAY BE THE LEADING, BUT NOT THE ONLY, DRIVING FORCE FOR WATER QUALITY TRADING MARKETS SMALL SCALE TRADING OPPORTUNITIES MAY EXIST {one has to assess the Impacts of strategic behavior on water quality} EVEN IF A WATERSHED HAS LIMITED OR NO POTENIAL FOR WATERSHED SCALE TRADING, OTHER TRADING OPPORTUNITIES MAY EXIST SITE SPECIFIC OFFSET OPPORTUNITIES MAY EXIST NPDES PERMIT HOLDER ARRANGES EQUIVALENT CONTROL FROM AN ALTERNATIVE DISCHARGE SOURCE INTRA-PLANT TRADES NPDES PERMIT HOLDER TRADES BETWEEN ITS OWN DISCHARGE POINTS TO LOWER COST OF CONTROL
THE VIABILITY OF TRADING IN THE TMDL • CONTEXT DEPENDS ON SOME CONDITIONS: • CLEAN WATER ACT – CWA • MARKETS STRUCTURED WITHIN CWA • PUBLIC INPUT • A SUITABLE & TRADABLE POLLUTANT • SUFFICIENT DIFFERENCES IN CONTROL COSTS • STAKEHOLDER WILLINGNESS TO PARTICIPATE • INCENTIVES TO PARTICIPATE • COST REDUCTION POSSIBILITIES PARTICIPATION BY NONPOINT SOURCES IS VOLUNTARY ---- THEREFORE INCENTIVES NEED TO EXIST FOR VOLUNTARY PARTICIPATION
TMDL POLICY TMDL --- TOTAL MAXIMUM DAILY LOAD ESTABLISHMENT OF TMDL REGULATION AND LEVELS ARE STATE RESPONSIBILITY EPA HAS REGULATORY OVERSIGHT ONCE ESTABLISHED, THE TMDL ALLOWABLE LOAD NEEDS TO BE ALLOCATED ACROSS POINT SOURCES AND NONPOINT SOURCES WITHIN A WATERSHED NATIONAL POLLUTANT DISCHARGE ELIMINATION SYSTEM (NPDES) PERMITS MAY BE INCOMPLETE TMDL IMPLEMENTATION MAY (OR MAY NOT) IMPOSE MORE STRINGENT DISCHARGE LIMITS ON NPDES PERMIT HOLDERS -- PROVIDING THE “DRIVER” FOR TRADING ACTIVITY
THE TMDL PROGRAM The TMDL program Requires states to develop TMDLs for waters on the 303(d) list Section 303(d) requires the identification and prioritization of waters not meeting in-stream water quality standards The TMDL includes a distribution of pollutant loading (allocation) that results in attainment of water quality standards Five key steps to TMDL development Identify water quality-limited waters (303(d) list) Prioritize water quality-limited waters Develop the TMDL plan for each water quality limited stream segment Implement the water quality improvement for each segment Assess water quality improvement for each segment
EPA TMDL EQUATION TMDL = WLA + LA + MOS (total max. daily load) (point source waste load allocation) (nonpoint load allocation) (margin of safety) State water quality standard for the pollutant given the stream’s designated beneficial use Citizens Politicians and Scientists Managers and Engineers TMDL development phase
TMDL FOCUS To determine the amount of pollution the water body is capable of assimilating while maintaining its intended beneficial uses
EPA WQT HANDBOOKS TWO HANDBOOKS FOR ASSESSMENT OF TRADING HAVE BEEN DEVELOPED BY EPA DEVELOPED TO MAP OUT INVESTIGATION AND STEPS TO DETERMINE FEASIBILITY OF WQT IN WATERSHEDS RECOMMENDATIONS FOR CARRYING OUT AN ASSESSMENT OF CONDITIONS AND POTENTIAL FOR WATERSHED SCALE TRADING OR OTHER FORMS OF MARKET-BASED MEANS OF IMPROVING WATER QUALITY
www.epa.gov/ncepihom Water Quality Trading Assessment Handbook EPA Region 10 Guide to Analyzing Your Watershed Water Quality Trading Assessment Handbook Can Water Quality Trading advance Your Watershed’s Goals? Region 10 (EMI – 163) EPA 910-B-03-003 July 2003 EPA 841-B-04-001 Office of Wetlands, Oceans and Watersheds November 2004 Assessment of: developing a watershed discharge profile pollutant Suitability financial attractiveness market infrastructure & sizing stakeholder readiness Appendices: nitrogen, phosphorus, temperature, & sediments suitability profiles
SEVERAL TRADING PROGRAMS ARE NOW IN ASSESSMENT, DEVELOPMENT, OR PERMITING PHASES COLORADO --- Boulder Creek ---- N TMDL and initiation of a trading case study IDAHO --- Lower Boise ---- Idaho DEQ draft on pollutant Trading Guidance --- we will hear about this one today MINNESOTA --- Minnesota River --- Lower Minnesota River NORTH CAROLINA --- Neuse River --- in permit phase
OHIO --- Great Miami Watershed --- development of an operations manual PENNSYLVANIA --- Development of a trading guide for the Chesapeake Bay trading program--- setting up broker roles WASHINGTON --- Water quality trading stability study WISCONSIN --- Red Cedar River study --- Fox-Wolf Watershed Alliance - Broker INTERSTATE PROGRAMS --- Chesapeake Bay water quality improvement AUSTRALIA ---- River Hunter salinity pilot program -- salinity licensing and trading
CURRENT WQT CONSIDERATIONS AROUND THE U.S. ENVIRONMENTAL TRADING NETWORK www.envtn.org.wqt/StatePrograms_page_html
See ENVIRONMENTAL TRADING NETWORK --- www.envtn.org.wqt/StatePrograms_page_html Bear R. Being Assessed
River Hunter Salinity Trading --- load licenses New South Wales Australia Credits to Katy Brady, NSW DEC Salinity load licensing and trading -- dealing with 3 river segments, 2 power plants and 22 coal mines along with nonpoint source issues
USEPA TARGETED WATERSHEDS GRANT Develop an integrated, Internet-based Watershed Information System (WIS) Investigate the feasibility of a water quality trading program Develop a water quality model to develop information & support the water quality trading
PROJECT PARTNERS USU Project Collaborators: Nancy Mesner Terry Glover David Stevens Arthur Caplan Jeff Horsburgh Bethany Neilson United States EPA Gary Kleeman Bear River Commission Jack Barnett Water Quality Task Force Mitch Poulson Wyoming DEQ Jack Smith Idaho DEQ Lynn Van Every Utah DEQ Mike Allred
WATER QUALITY TRADING IN THE BEAR RIVER WATERSHED: ISSUES AND INFORMATION NEEDS
TRADING FOCUS AREA AND POLLUTANT Bear River from Oneida Narrows Reservoir to Cutler Reservoir Cub River – Middle Bear Little Bear River Spring Creek Focus on areas with existing TMDLs Focus on total phosphorus (TP) reduction
CUB RIVER SUBWATERSHED Middle Bear River Cub River
HYPOTHETICAL WATERSHED River Flow NPS = nonpoint source PS = point source NPS 3 NPS 2 NPS 1 Suppose NPS 1 wants to trade reduction in TP PS Lake or reservoir Receptor Point
NPS 1 needs to estimate TP reductions -- estimate current load contribution = CL -- choose suitable BMP practice & reductions resulting from such a practice -- determine baseline for trading -- use ratios (which may be determined by program rules) to adjust available TP reduction eligible for trading -- determine TP reductions needed by a buyer TMDL only specifies Allowable watershed load & NPS’s reduce TP by 50% Trading program & rules are in place NPS 1 needs information on TP emission given current management practice ---- tons/year X lbs. P/ton = CL = 2190 lbs./year year may be the 3-month irrigation season Choice of BMP is rated at 100% effective but has 10% uncertainty discount TP discharge X (BMP effectiveness – discount) = BMP TP reduction BMP reduction =2190 X (1.0 -0.10) = 1971
NPS 1 baseline TP removal requirement via the TMDL is 50% Required reduction by TMDL = 2190 X 0.50 = 1095 lbs TP/year Will NPS 1 BMP Phosphorus reduction produce enough reduction so that trading can be initiated? BMP TP reduction – Baseline requirement = TP reduction eligible 1971 – 1095 = 876 lbs TP/year NPS 1 needs information on a delivery ratio = d = the fraction of a pound that reaches the water body of interest for every pound of TP discharge This information is either contained in the rules for the NPS location or comes from water quality modeling or both ---- important information Assume the ratio is 1:0.90 TP reduction eligible for trading X 0.90 = adjusted TP reduction 876 X 0.90 = 788 (rounded) lbs TP / year
PS The point source, PS, needs 280 lbs per month during the irrigation season NPS 1 needs To find A buyer The BMP guidance document provides information on flow-loss factors for each month {information needed} to account for irrigation events and sediment loss These are 0.35 for June – 0.45 for July – 0.20 for August Monthly TP reductions eligible for trading yearly TP reduction X flow-loss factor = monthly TP reduction (rounded) 788 X 0.35 = 276 lbs TP/ month for June 788 X 0.45 = 355 lbs TP / month for July 788 X 0.30 = 236 lbs TP / month for August Average control cost = total cost / reductions achieved for the PS = $2,222 for Tier 1 control by the PS and $10,667 for Tier 2 control ---- and $438 for NPS 1 ----- there is potential for NPS1 and the PS to connect & contract
ENVIRONMENTAL PROFILE OF WATERSHED Assumption: Target Load (TL) for Basin at receptor = 350 CL = current load; % Total NPS CL = CL/NPS Total CL;TL = %CL(NPS Total TL); Adj. TL = Adjusted TL = TL/Delivery ratio;TMDL Red. = TMDL Reduction = CL – Adjusted TL---- Delivery ratio = 1 unit of a source’s emissions increases a pollution level by d units
ECONOMIC PROFILE OF WATERSHED Scientific Literature Red. Achd. = reduction achieved;Ave. Control Cost = Total Cost/Red. Achd.;Credits = Red. Achd. – TMDL Red.
MATRIX OF TRADING RATIOS Trading Ratio = Purchaser’s Delivery Ratio / Seller’s Delivery Ratio, or 1 unit of firm i emissions = t units of firm j emissions
EXAMPLES OF POSSIBLE TRADES 1. NPS 1 Sells Credits to PS • Why Trade? NPS 1’s Average Control Cost ($438 per unit reduced) • is lower than PS’s (weighted) Average Control Cost ($4,317per unit reduced). PS/NPS1 Trading Ratio • Trade Volume? NPS 1 has 93 / 1.11 = 84 effectivecredits • available for sale to PS. 2. NPS 3 Sells Credits to NPS 2 • Why Trade? NPS 3’s Average Control Cost ($313 per unit reduced) • is lower than NPS 2’s Average Control Cost ($556 per unit reduced). NPS2/NPS3 Trading Ratio • Trade Volume? NPS 3 has 131 / 1.14 = 115 effectivecredits • available for sale to NPS 2.
Possible Trade (Assuming Trading Ratio = 1 for now.) • Preston WWTP • Current Load = 3,563 lbs/yr • Target Load = 115 lbs/yr • TMDL Reduction = 3,449 lbs/yr • Nonpoint source • Current Load = 221 lbs/yr • Target Load = 37 lbs/yr • TMDL Reduction = 184 lbs/yr • Is it beneficial for Preston WWTP to trade with nonpoint source? Preston WWTP Nonpoint source
Nonpoint source is able to create 16 (200 – 184) credits by implementing conservation tillage (assuming 90% control rate). • Nonpoint source 1 could profit by selling each credit to the Preston WWTP for an amount greater than $2.78. • Preston WWTP could lower their cost of compliance by buying nonpoint source’s 16 credits for less than $101.48 per credit.
CHALLENGES FOR THE NONPOINT SOURCE The TMDL allocates a watershed load amongst sources in general --- not for each nonpoint source • The nonpoint source needs considerable information—needs to be in on rule development --- uncertainty considerations related to delivery and trading ratios • There is potential for high transactions costs of trade related activities --- these could be modified by association programs and pollutant credit exchanges • Complicated procedures associated with ill-defined programs and rules • Liability concerns ---- is the liability placed on the permitted facility? What of liability and nonpoint to nonpoint trades? • How is compliance certified? Who certifies and monitors? Regulator-nonpoint-point source understanding and relationship during trading activity • Fear that trading rules are subject to change--- cost share programs change or fade in the future • Contractual, payment and default concerns --- recourse issues
Will the point Source be Interested in trading? There are several conditions under which a point source might be interested in trading • They need to meet discharge limits under NPDES in impaired waters • They may need to minimize pollutant loads in impaired waters prior to the development of a TMDL regulation ---- Which may preclude a TMDL • They may need to deal with more stringent discharge limits under TMDL regulation • The point source may have to accommodate an increase in discharge due to anticipated growth • Point sources face increased costs to control pollutants • Municipal and regional wastewater treatment plants are connected to taxing powers and sewerage charge bases • They need information just as the nonpoint source needs information • Point sources may be connected to secondary markets for pollutant reductions or may be a basis for formation of regional associations
CHALLENGES IN THE RULE MAKING All of the Nonpoint & Point Source concerns Who develops the rules? Information -- Uncertainties Reduction credit guidelines There are other Nonpoint sources --Land in Development transition --Road & Construction sites __ Parking lots -- Lawns & Golf courses --- Dams, levies, channelization, culverts, diversions
WHO IS INVOLVED IN SETTING UP WQT? -- TMDL regulators (state or watershed rules) --- Water agencies --- Legal services -- Broker-traders ---- Nonpoint & point source firms ---- Funding/cost share sources & agencies ---- Consumers/taxpayers Guidelines on what constitutes credits that can be traded and definitions of possible permits associated with these credits need to be developed All parties to trading activities need to be involved in the development of the rules of the trading program McNees Wallace &Nurick LLC WATER QUALITY NUTRIENT CREDIT TRADING GUIDE May 2006 www.envtn.org/wqt - Example credit trading guide Legal documentation of nutrient credits, contracting, BMP considerations for the Chesapeake Watershed potential trading operations
There may be considerable uncertainty Such as uncertainty with respect to the value of Delivery ratios In this case the regulator likely is given authority to set a permit cap and trading ratios, given a target in expected pollution Regulator is given a target in expected pollution Regulator decides permit cap and trading ratio not knowing cost differences and delivery ratio Trading in permits associated with credits takes place and discharges are determined as related to cost of abatement Natural conditions determine the delivery ratios and actual pollution is derived The pollution reduction target in the uncertainty case is an average depending on several conditions
WHY DO WE NEED A MODEL TO STUDY THE POTENTIAL FOR TRADING? • Simulate the physical, chemical, and biological processes that affect pollutant concentrations • Consider spatial and temporal nature of pollutant loading • Calculate delivery ratios to • Determine the environmental equivalence of load reductions and potential trades
Producer X River Mile 15 WHY DO WE NEED A MODEL? Producer Y River Mile 5 Animal Producer Z River Mile 10 Point Source River Mile 1 Agricultural Diversion (50%) River Mile 7 Monitoring Location Receptor Point River Mile 0
WHY DO WE NEED A MODEL? Producer X River Mile 15 Total Phosphorus Load = 100 kg Producer X could only reduce loading at the receptor point by 40.5 kg even though his total loading is 100 kg! Delivery Ratio = 40.5/100 = 0.405 Loss to uptake/settling prior to diversion = 10% or 10 kg (90 kg left) Loss to uptake/settling prior to receptor point = 10% or 4.5 kg (40.5 kg left) Loss to Diversion = 50 % or 45 kg/yr (45 kg left) Monitoring Location Receptor Point River Mile 0
WHY DO WE NEED A MODEL? Producer Y can reduce loading at the receptor point by 90 kg if he eliminates his entire loading. Delivery Ratio = 90/100 = 0.9 Total Load = 100 kg Producer Y River Mile 5 Loss to uptake/settling prior to receptor point = 10% or 10 kg (90 kg left) Monitoring Location Receptor Point River Mile 0
WHAT DOES THIS MEAN? • The point source’s cost per unit phosphorus reduction with Producer X would be higher than Producer Y • Producer X can only get credit for 40% of any load reduction that he creates • Producer Y can get credit for 90% • It would be more economical for the point source to trade with Producer Y • It is critical to have an estimate of the delivery ratios