Figure 18.1a
Midsternal line. 2nd rib. Sternum. Diaphragm. Point of maximal intensity (PMI). (a). Figure 18.1a. Aorta. Superior vena cava. Parietal pleura (cut). Pulmonary trunk. Left lung. Pericardium (cut). Apex of heart. Diaphragm. (c). Figure 18.1c. Pulmonary trunk.


Figure 18.1a
E N D
Presentation Transcript
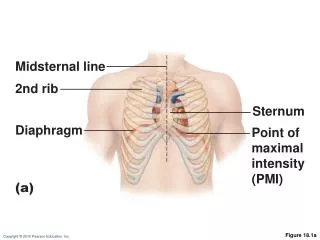
Midsternal line 2nd rib Sternum Diaphragm Point of maximal intensity (PMI) (a) Figure 18.1a
Aorta Superior vena cava Parietal pleura (cut) Pulmonary trunk Left lung Pericardium (cut) Apex of heart Diaphragm (c) Figure 18.1c
Pulmonary trunk Fibrous pericardium Parietal layer of serous pericardium Pericardium Pericardial cavity Myocardium Epicardium (visceral layer of serous pericardium) Heart wall Myocardium Endocardium Heart chamber Figure 18.2
Left common carotid artery Brachiocephalic trunk Left subclavian artery Superior vena cava Aortic arch Ligamentum arteriosum Right pulmonary artery Left pulmonary artery Ascending aorta Left pulmonary veins Pulmonary trunk Right pulmonary veins Auricle of left atrium Circumflex artery Right atrium Left coronary artery (in coronary sulcus) Right coronary artery (in coronary sulcus) Anterior cardiac vein Left ventricle Right ventricle Great cardiac vein Right marginal artery Anterior interventricular artery (in anterior interventricular sulcus) Small cardiac vein Inferior vena cava Apex (b) Anterior view Figure 18.4b
Atria: The Receiving Chambers • Walls are ridged by pectinate muscles • Vessels entering right atrium • Superior vena cava • Inferior vena cava • Coronary sinus • Vessels entering left atrium • Right and left pulmonary veins
Ventricles: The Discharging Chambers • Walls are ridged by trabeculae carneae • Papillary muscles project into the ventricular cavities • Vessel leaving the right ventricle • Pulmonary trunk • Vessel leaving the left ventricle • Aorta
Aorta Left pulmonary artery Superior vena cava Left atrium Right pulmonary artery Left pulmonary veins Pulmonary trunk Right atrium Mitral (bicuspid) valve Right pulmonary veins Fossa ovalis Aortic valve Pectinate muscles Pulmonary valve Tricuspid valve Left ventricle Papillary muscle Right ventricle Interventricular septum Chordae tendineae Trabeculae carneae Epicardium Inferior vena cava Myocardium Endocardium (e) Frontal section Figure 18.4e
Pathway of Blood Through the Heart • The heart is two side-by-side pumps • Right side is the pump for the pulmonary circuit • Vessels that carry blood to and from the lungs • Left side is the pump for the systemic circuit • Vessels that carry the blood to and from all body tissues
Capillary beds of lungs where gas exchange occurs Pulmonary Circuit Pulmonary veins Pulmonary arteries Aorta and branches Venae cavae Left atrium Left ventricle Right atrium Heart Right ventricle Systemic Circuit Oxygen-rich, CO2-poor blood Capillary beds of all body tissues where gas exchange occurs Oxygen-poor, CO2-rich blood Figure 18.5
Pathway of Blood Through the Heart • Equal volumes of blood are pumped to the pulmonary and systemic circuits • Pulmonary circuit is a short, low-pressure circulation • Systemic circuit blood encounters much resistance in the long pathways
Left ventricle Right ventricle Interventricular septum Figure 18.6
Coronary Circulation • The blood supply to heart muscle
Aorta Pulmonary trunk Superior vena cava Left atrium Anastomosis (junction of vessels) Left coronary artery Right atrium Circumflex artery Right coronary artery Left ventricle Right ventricle Anterior interventricular artery Right marginal artery Posterior interventricular artery (a) The major coronary arteries Figure 18.7a
Superior vena cava Great cardiac vein Anterior cardiac veins Coronary sinus Small cardiac vein Middle cardiac vein (b) The major cardiac veins Figure 18.7b
Aorta Superior vena cava Left pulmonary artery Right pulmonary artery Right pulmonary veins Left pulmonary veins Auricle of left atrium Right atrium Left atrium Inferior vena cava Great cardiac vein Coronary sinus Right coronary artery (in coronary sulcus) Posterior vein of left ventricle Posterior interventricular artery (in posterior interventricular sulcus) Left ventricle Apex Middle cardiac vein Right ventricle (d) Posterior surface view Figure 18.4d
Homeostatic Imbalances • Angina pectoris • Thoracic pain caused by deficiency in blood delivery to the myocardium • Cells are weakened • Myocardial infarction (heart attack) • Prolonged coronary blockage • Cell die & are repaired with scar tissue
Heart Valves • What purpose do valves serve? • Where are they located? • What would you call them?
Myocardium Tricuspid (right atrioventricular) valve Mitral (left atrioventricular) valve Aortic valve Pulmonary valve Pulmonary valve Aortic valve Area of cutaway (b) Mitral valve Tricuspid valve Figure 18.8b
Pulmonary valve Aortic valve Area of cutaway Mitral valve Tricuspid valve Chordae tendineae attached to tricuspid valve flap Papillary muscle (c) Figure 18.8c
Opening of inferior vena cava Mitral valve Chordae tendineae Tricuspid valve Myocardium of right ventricle Myocardium of left ventricle Pulmonary valve Aortic valve Area of cutaway Papillary muscles Mitral valve Interventricular septum Tricuspid valve (d) Figure 18.8d
1 Blood returning to the heart fills atria, putting pressure against atrioventricular valves; atrioventricular valves are forced open. Direction of blood flow Atrium Cusp of atrioventricular valve (open) 2 As ventricles fill, atrioventricular valve flaps hang limply into ventricles. Chordae tendineae 3 Atria contract, forcing additional blood into ventricles. Papillary muscle Ventricle (a) AV valves open; atrial pressure greater than ventricular pressure Atrium 1 Ventricles contract, forcing blood against atrioventricular valve cusps. Cusps of atrioventricular valve (closed) 2 Atrioventricular valves close. Blood in ventricle 3 Papillary muscles contract and chordae tendineae tighten, preventing valve flaps from everting into atria. (b) AV valves closed; atrial pressure less than ventricular pressure Figure 18.9
Aorta Pulmonary trunk As ventricles contract and intraventricular pressure rises, blood is pushed up against semilunar valves, forcing them open. (a) Semilunar valves open As ventricles relax and intraventricular pressure falls, blood flows back from arteries, filling the cusps of semilunar valves and forcing them to close. (b) Semilunar valves closed Figure 18.10
Nucleus Intercalated discs Cardiac muscle cell Gap junctions Desmosomes (a) Figure 18.11a
Superior vena cava Right atrium Thesinoatrial (SA) node(pacemaker) generates impulses. 1 Internodal pathway Left atrium 2 The impulses pause (0.1 s) at the atrioventricular (AV) node. Purkinje fibers Theatrioventricular (AV) bundle connects the atria to the ventricles. 3 Thebundle branches conduct the impulses through the interventricular septum. 4 Inter- ventricular septum ThePurkinje fibers depolarize the contractile cells of both ventricles. 5 (a) Anatomy of the intrinsic conduction system showing the sequence of electrical excitation Figure 18.14a
Homeostatic Imbalances • Defects in conduction system may result in • Arrhythmias: irregular heart rhythms • Uncoordinated atrial and ventricular contractions • Fibrillation: rapid, irregular contractions; useless for pumping blood
Homeostatic Imbalances • Defective SA node may result in • Ectopic focus: abnormal pacemaker takes over • If AV node takes over, there will be a junctional rhythm (40–60 bpm) • Defective AV node may result in • Partial or total heart block • Few or no impulses from SA node reach the ventricles
Dorsal motor nucleus of vagus The vagus nerve (parasympathetic) decreases heart rate. Cardioinhibitory center Medulla oblongata Cardio- acceleratory center Sympathetic trunk ganglion Thoracic spinal cord Sympathetic trunk Sympathetic cardiac nervesincrease heart rate and force of contraction. AV node SA node Parasympathetic fibers Sympathetic fibers Interneurons Figure 18.15
Electrocardiography • Electrocardiogram (ECG or EKG): a composite of all contractile cells • Three waves • P wave: depolarization of SA node • QRS complex: ventricular depolarization • T wave: ventricular repolarization
QRS complex Sinoatrial node Ventricular depolarization Ventricular repolarization Atrial depolarization Atrioventricular node S-T Segment P-Q Interval Q-T Interval Figure 18.16
Depolarization Repolarization SA node R R T P T P Q S 1 Atrial depolarization, initiatedby the SA node, causes theP wave. Q S 4 Ventricular depolarizationis complete. R AV node R T P T P Q S Q 2 With atrial depolarizationcomplete, the impulse isdelayed at the AV node. S 5 Ventricular repolarizationbegins at apex, causing theT wave. R R T P T P Q S Q S 3 Ventricular depolarizationbegins at apex, causing theQRS complex. Atrialrepolarization occurs. 6 Ventricular repolarizationis complete. Figure 18.17
R Depolarization SA node Repolarization T P Q S 1 Atrial depolarization, initiated bythe SA node, causes the P wave. Figure 18.17, step 1
R Depolarization SA node Repolarization T P Q S 1 Atrial depolarization, initiated bythe SA node, causes the P wave. R AV node T P Q S 2 With atrial depolarization complete,the impulse is delayed at the AV node. Figure 18.17, step 2
R Depolarization SA node Repolarization T P Q S 1 Atrial depolarization, initiated bythe SA node, causes the P wave. R AV node T P Q S 2 With atrial depolarization complete,the impulse is delayed at the AV node. R T P Q S 3 Ventricular depolarization beginsat apex, causing the QRS complex.Atrial repolarization occurs. Figure 18.17, step 3
Depolarization Repolarization R T P Q S 4 Ventricular depolarization iscomplete. Figure 18.17, step 4
Depolarization Repolarization R T P Q S 4 Ventricular depolarization iscomplete. R T P Q S 5 Ventricular repolarization beginsat apex, causing the T wave. Figure 18.17, step 5
Depolarization Repolarization R T P Q S 4 Ventricular depolarization iscomplete. R T P Q S 5 Ventricular repolarization beginsat apex, causing the T wave. R T P Q S 6 Ventricular repolarization iscomplete. Figure 18.17, step 6
Depolarization Repolarization SA node R R T P T P Q S 1 Atrial depolarization, initiatedby the SA node, causes theP wave. Q S 4 Ventricular depolarizationis complete. R AV node R T P T P Q S Q 2 With atrial depolarizationcomplete, the impulse isdelayed at the AV node. S 5 Ventricular repolarizationbegins at apex, causing theT wave. R R T P T P Q S Q S 3 Ventricular depolarizationbegins at apex, causing theQRS complex. Atrialrepolarization occurs. 6 Ventricular repolarizationis complete. Figure 18.17
(a) Normal sinus rhythm. (b) Junctional rhythm. The SA node is nonfunctional, P waves are absent, and heart is paced by the AV node at 40 - 60 beats/min. (d) Ventricular fibrillation. These chaotic, grossly irregular ECG deflections are seen in acute heart attack and electrical shock. (c) Second-degree heart block. Some P waves are not conducted through the AV node; hence more P than QRS waves are seen. In this tracing, the ratio of P waves to QRS waves is mostly 2:1. Figure 18.18
Heart Sounds • Two sounds (lub-dup) associated with closing of heart valves • First sound occurs as AV valves close and signifies beginning of systole • Second sound occurs when SL valves close at the beginning of ventricular diastole • Heart murmurs: abnormal heart sounds most often indicative of valve problems
Aortic valvesounds heard in 2nd intercostal space at right sternal margin Pulmonary valve sounds heard in 2nd intercostal space at left sternal margin Mitral valvesounds heard over heart apex (in 5th intercostal space) in line with middle of clavicle Tricuspid valvesounds typically heard in right sternal margin of 5th intercostal space Figure 18.19
Mechanical Events: The Cardiac Cycle • Cardiac cycle: all events associated with blood flow through the heart during one complete heartbeat • Systole—contraction • Diastole—relaxation
Phases of the Cardiac Cycle • Ventricular filling—takes place in diastole • AV valves are open • 80% of blood passively flows into ventricles • Atrial systole occurs, delivering the remaining 20%
Phases of the Cardiac Cycle • Ventricular systole • Atria relax and ventricles begin to contract • Rising ventricular pressure closes AV valves • All valves are closed • In ejection phase, ventricular pressure exceeds pressure in the large arteries, forcing the SL valves open
Left heart QRS P T P Electrocardiogram 1st 2nd Heart sounds Dicrotic notch Aorta Pressure (mm Hg) Left ventricle Atrial systole Left atrium EDV Ventricular volume (ml) SV ESV Atrioventricular valves Open Closed Open Aortic and pulmonary valves Closed Open Closed Phase 1 2a 2b 3 1 Left atrium Right atrium Left ventricle Right ventricle Ventricular filling Atrial contraction Ventricular ejection phase Isovolumetric relaxation Ventricular filling Isovolumetric contraction phase 1 2a 2b 3 Ventricular filling (mid-to-late diastole) Ventricular systole (atria in diastole) Early diastole Figure 18.20
Cardiac Output (CO) • Volume of blood pumped by each ventricle in one minute • CO = heart rate (HR) x stroke volume (SV) • HR = number of beats per minute • SV = volume of blood pumped out by a ventricle with each beat
Exercise (by skeletal muscle and respiratory pumps; see Chapter 19) Bloodborne epinephrine, thyroxine, excess Ca2+ Exercise, fright, anxiety Heart rate (allows more time for ventricular filling) Venous return Sympathetic activity Parasympathetic activity Contractility EDV (preload) ESV Heart rate Stroke volume Cardiac output Initial stimulus Physiological response Result Figure 18.22
Chemical Regulation of Heart Rate • Hormones • Epinephrine and thyroxineenhance heart rate and contractility • Intra- and extracellular ion concentrations (e.g., Ca2+ and K+) must be maintained for normal heart function
Other Factors that Influence Heart Rate • Age • Gender • Exercise • Body temperature
Homeostatic Imbalances • Tachycardia: abnormally fast heart rate (>100 bpm) • If persistent, may lead to fibrillation • Bradycardia: heart rate slower than 60 bpm • May result in grossly inadequate blood circulation • May be desirable result of endurance training