Chesapeake 2000 and the Bay
520 likes | 810 Views
Chesapeake 2000 and the Bay. The Chesapeake Bay is North America’s largest and most biologically diverse estuary, home to more than 3,600 species of plants, fish and animals.

Chesapeake 2000 and the Bay
E N D
Presentation Transcript
The Chesapeake Bay is North America’s largest and most biologically diverse estuary, home to more than 3,600 species of plants, fish and animals.
For more than 300 years, the Bay and its tributaries have sustained the region’s economy anddefined its traditions and culture.
It is a resource of extraordinary productivity, worthy of the highest levels ofprotection and restoration.
The Chesapeake Bay Program Partnership Governor of MD Governor of PA Governor of VA Mayor of DC EPA Administrator Executive Council Chair of Chesapeake Bay Commission
The Bay and its rivers are doing betterthan they were when the firstChesapeake Bay Agreement was signed in 1983,but we still have a way to go before we reach our goals for a restored Chesapeake.
The Chesapeake 2000 Agreement In 2000, the Chesapeake Bay Program partners took stock of new challenges and technology and set a bold new course into the 21st Century. The latest agreement, Chesapeake 2000, is a comprehensive blueprint for restoring the Bay and its living resources over the next decade.
Chesapeake 2000 Goal:Living Resource Protection and Restoration “Restore, enhance and protect the finfish, shellfish and other living resources, their habitats and ecological relationships to sustain all fisheries and provide for a balanced ecosystem.”
Blue Crabs at Risk The new agreement commits to establish harvest targets for the blue crab fishery. Bay partners met this commitment when they agreed to increase spawning potential by reducing current harvests 15% by 2003. Mature Female Blue Crabs Blue Crab populations have stabilized at below-average levels. Improved water quality and habitat restoration efforts along with proper management of the crab harvest are needed to restore the Bay’s blue crab populations. Average
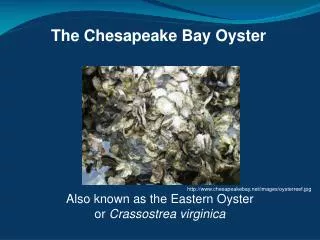
Oysters at Historic Lows The Chesapeake 2000 agreement commits to achieve a tenfold increase of native oysters in the Bay by 2010 and to establish oyster reefs and sanctuaries in strategic locations. Oyster populations in the Chesapeake are at historic lows due to disease, intense harvest pressure and poor water quality.
Year 2014 Goal (2,807 miles) Year 2004 Goal Achievement (1,807 miles) Migratory and Resident Fish Habitat Expanding The removal of dams and the construction of fish passages are reopening native spawning grounds to migratory and resident fish in many parts of the watershed. When combined with stocking efforts, migratory species are beginning to return. The removal of dams and fishway construction from 1988 through 2005 reopened 1,838 miles of historic habitat to migratory and resident fish. The new agreement commits to set a new goal for additional fish passages and to revise fishery management plans to include habitat and target population sizes for migratory fish.
Shad Are Starting to Make a Comebackbut Have a Long, Long Way to Go Stocking efforts, a moratorium, and fish passage development increased the number of shad counted at Conowingo Dam from several hundred per year in the early 1980s to an average of 101,140 per year in 2003-2005.
Rockfish Population Stable Baywide Female Spawning Stock Biomass Rockfish have rebounded to levels not seen since the 1950’s, but concerns remain over disease, sufficient sources of food and availability of spawning habitat. Fishing moratoria: MD & DE: 1985-1990 VA: 1989-1990 Although we have sustainable populations of striped bass, we do not have sustainable populations of many other species. The new agreement commits to develop ecosystem-based multi-species management plans for targeted species by 2005.
The new agreement contains additional commitments related to living resources: Identify invasive (exotic) species that have potential to harm the Bay (by 2001) and develop ways to manage them (by 2003). Nutria Mute swans Phragmites Purple loosestrife Water chestnut Zebra mussels Bay partners identified and ranked six priority invasive species. They are currently developing and implementing management plans to address the impact and control of those deemed most problematic to the Bay ecosystem’s restoration and integrity.
Chesapeake 2000 Goal:Vital Habitat Protection and Restoration “Preserve, protect and restore those habitats and natural areas that are vital to the survival and diversity of the living resources of the Bay and its rivers.”
Bay Grasses Show Annual Variation Restoration Goal (185,000 acres by 2010) Underwater bay grasses are slowly improving, but further reductions in the pollutants flowing into the Bay are needed to help them flourish. Annual variations in bay grasses show the sensitivity of the Bay ecosystem. *Note – Hatched area of bar includes estimated additional acreage. No Baywide surveys 1979-83 and 1988 Source: Chesapeake Bay Program. The new agreement commits to revise goals to reflect historic abundance. Bay partners met this commitment by agreeing to increase the goalto 185,000 acres by 2010.
Riparian Forest Buffer Restoration Current 2010 Goal:10,000 miles (established 2003) Initial 2010 Goal:2,010 miles (established 1996) Streamside Forests Sprouting Up The new agreement commits to establish a new goal to expand forest buffer mileage and to conserve all existing mileage. In 2003, the partners committed to conserve and restore forests along at least 70% of all streams and shoreline in the watershed, with a near term goal of at least 10,000 miles by 2010. Forest buffer restoration is improving local waterways throughout the Bay watershed by preventing pollutants from entering the rivers and improving wildlife habitat. About 60 percent of the riparian area is currently forested. Riparian Forest Buffers (59%) 4,606 miles restored 1996 through August 2005.
Wetlands Are Being Restored Wetland reestablishment and establishment (cumulative acres). 2010 Goal: 25,054 acres Wetlands are a valuable piece of the Bay’s ecosystem. They filter and capture pollutants, provide wildlife habitat, protect shorelines and reduce flooding. Wetlands are being restored throughout the watershed, but remain at risk to development pressures. We have achieved 40% of the wetland acreage gain goal through non-regulatory programs. Data Collection In Progress The new agreement commits to restore 25,000 acres of tidal and non-tidal wetlands by 2010.
Watershed Management Plans • The new agreement commits to implement locally supported watershed management plans in 2/3 of the Bay watershed by 2010. • The plans need to: • “Address the protection, conservation and restoration of stream corridors, riparian forest buffers and wetlands” • Reflect the goals and objectives of “improving habitat and water quality” • Identify implementation mechanisms • Have demonstrated local support. • As of December 2004, watershed management plans have been developed and are being implemented on 9.7 million acres in the watershed portions of MD, PA, VA and DC. In order to achieve the goal, plans need to be developed for 13 million additional acres by 2010. Source: Chesapeake Bay Program. *Represents the cumulative total as of December, 2004. 2004 acreages are estimated using the best information available. It is expected that tracking of watershed management planning will be improved and 2004 data may be adjusted, both for overestimates and underestimates of acreage covered by plans.
The new agreement also commits to: • Achieve a no-net loss of existing wetlands acreage and function. • Implement wetlands preservation plans in 25% of the watershed by 2010.
Chesapeake 2000 Goal: Water Quality Restoration and Protection “Achieve and maintain the water quality necessary to support the aquatic living resources of the Bay and its tributaries and to protect human health.”
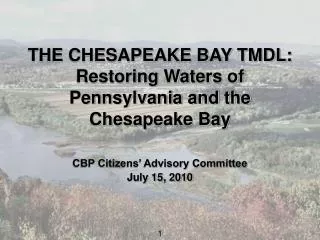
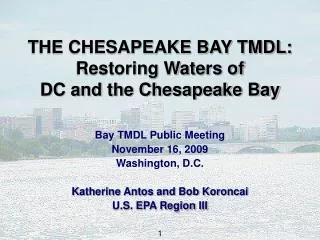
Bay and River Water Quality Commitment In order to achieve and maintain the water quality necessary to support aquatic living resources, the partners committed to: Achieve and maintain the 40% nutrient reduction goal agreed to in 1987 and… By 2010, correct the nutrient‑ and sediment‑related problems in the Chesapeake Bay and its tidal tributaries sufficiently to remove the Bay and the tidal portions of its tributaries from the list of impaired waters under the Clean Water Act. Section 1: What Do We Want to Achieve
Chesapeake Bay and Tidal Tributary Nutrient and/or Sediment Impaired Waterbodies Impaired Waters and Clean-up Plans Portions of the Chesapeake Bay and its tidal rivers are listed under the Clean Water Act as “impaired waters” largely because of low dissolved oxygen levels and other problems related to nutrient pollution. This “listing” requires the development of a clean-up plan for the Bay by 2011. Note: Representation of 303(d) listed waters for nutrient and/or sediment water quality impairments for illustrative purposes only. For exact 303(d) listings contact EPA (http://www.epa.gov/owow/tmdl/). Impaired Water Unimpaired Water Section 1: What Do We Want to Achieve
Watershed-wide Pollution Reductions Needed The pollutants causing water quality impairments drain into to the Bayand its rivers fromthe entire watershed. New York Pennsylvania Maryland Delaware West Virginia Chesapeake Bay Watershed Boundary District of Columbia Virginia Section 1: What Do We Want to Achieve
2010 Nitrogen Goal 2010 Phosphorus Goal 2010 Sediment Goal Progress toward Meeting Nutrient and Sediment Goals Limited The Chesapeake Bay Program Watershed Model provides program managers with a way to estimate the nutrient and sediment reductions that will likely occur as pollution abatement practices are implemented throughout the watershed. These reduction estimates also provide an indication of the pollutant load that would flow into the Bay in an "average” year. Using the model, managers can project the future response of various management actions put in place today. Based on Bay watershed model simulations, 58% of the phosphorus, 41% of the nitrogen and 54% of the sediment reduction goals have been achieved. Source: CBP Phase 4.3 Watershed Model. Estimates of nutrient and land-based sediment reductions that may occur when the reported management practices and reduction technologies are implemented within watershed portions of NY, PA, MD, DC, DE, WV, VA. The model's nonpoint source load reductions are estimates of what would occur under long-term avergaed rainfall conditions based on the years 1985-1994. The point source load reductions are actual measurements and are influenced by the reporting year’s rainfall.
Phosphorus Concentrations Declining in Some of theNon-tidal Portions of the Rivers Monitoring data shows that concentrations of nitrogen flowing into the Bay are decreasing in many of the Bay’s major tributaries. These charts use flow-adjusted data, which are ‘normalized’ to account for seasonal and year-to-year variability in weather patterns. 1985 – 2004 Decreasing No significant trend Increasing
Nitrogen Concentrations Declining in Some of theNon-tidal Portions of the Rivers Monitoring data shows that concentrations of phosphorus flowing into the Bay are decreasing in many of the Bay’s major tributaries. These charts use flow-adjusted data, which are ‘normalized’ to account for seasonal and year-to-year variability in weather patterns. 1985 – 2004 Decreasing No significant trend Increasing
Sediment Concentrations Declining in Some of theNon-tidal Portions of the Rivers Monitoring data shows that concentrations of sediment flowing into the Bay are decreasing in some of the Bay’s major tributaries. These charts use flow-adjusted data, which are ‘normalized’ to account for seasonal and year-to-year variability in weather patterns. 1980s – 2004 Decreasing No significant trend Increasing
Restored Water Quality Means: • More oxygen and improved habitat for more fish, crabs and oysters. • Clearer water and more underwater Bay grasses. • Fewer algae blooms and better fish food. Section 2: How Might the Bay Look?
Restoration Goal (100%) Dissolved Oxygen Standards Attainmentin Chesapeake Bay and Its Tidal Tributaries During June -September when water quality is poorest. Between 2002 and 2004, 56.8% of the combined volume of open water, deep water and deep channel water of the Bay and its tidal tributaries was in attainment of proposed standards for dissolved oxygen. This compares to 40.6% when the Bay Program started in 1985-87, but still far short of the 100% needed in order to meet standards.
Water ClarityImprovements NeededIn Key Habitat Areas Water clarity is critical to the health of underwater grasses that provide important habitat for many Bay animals. Water clarity is a measure of the amount of sunlight that penetrates the Bay’s waters and reaches the surface of underwater Bay grass leaves. The amount needed is determined by the specific underwater grasses which grow in different areas of the Bay. Increases in sediment and nutrient concentrations in the water lead to declines in water clarity.
Mixed Trendsin Algae Levels Chlorophyll a – a pigment found in plants – is measured to determine the amount of algae present in the water. Monitoring data shows mixed trends in algae levels in the Bay and its major tributaries. Excessive nutrients can stimulate algae blooms resulting in reduced water clarity and depleted oxygen levels.
Status of Chemical Contaminant Effectson Living Resources in the Bay’s Tidal Rivers The new agreement commits to reduce chemical contaminants to levels that result in no toxic or bioaccumulative impact on living resources that inhabit the Bay or on human health and…through voluntary means, strive for zero release of chemical contaminants from point sources, including air sources.
Chesapeake 2000 Goal: Sound Land Use “Develop, promote and achieve sound land use practices which protect and restore watershed resources and water quality, maintain reduced pollutant loadings for the Bay and its tributaries, and restore and preserve aquatic living resources.”
High Development Pressure (HDP) Close Proximity to HDP 30% Rate Reduction Goal Patterns of Land Use and Consumption of Natural Resources Threaten Our Progress The new agreement commits to reduce the rate of harmful sprawl development of forest and agricultural land in the watershed by 30 percent by 2012. Areas of Highest Development Pressure in the Watershed Impervious Cover Since 1950, the Bay watershed’s population has doubled to about 16 million people. As the population of the watershed grows, so does our footprint on the landscape. In the past decade, population increased by about 8 percent, while the amount of impervious surface increased by 41 percent, representing an area five times the size of the nation’s capital. Managing future growth will be critical to preserving gains made during the first two decades of Bay restoration efforts.
The new agreement commits to permanently preserve from development 20 percent of the land area in the watershed by 2010. Acres of Preserved Land Year 2010 Goal (6.9 million) Between July 2000 and July 2005, 600,843 acres of land were preserved in the watershed portions of MD, PA, VA and DC. The total land area preserved is currently estimated at 6.7 million acres. In order to achieve the goal, an additional 213,417 acres need to be preserved.
The new agreement commits to rehabilitate and restore 1,050 brownfields sites to productive use by 2010. Brownfield Sites Ready for Redevelopment One hundred and eighteen brownfield sites were cleaned and made ready for redevelopment between July 2004 and June 2005. This brings the current total up to 532. In order to achieve the goal we need 518 more by 2010. Goal: 1,050 by 2010 532 414 284 173 86
The new agreement commits to expand by 30 percent the system of public access points to the Bay by 2010. Public Access Points to the Bay and its Tributaries During 2005, the following has been completed to acquire, develop or enhance access opportunities: 5 new or enhanced sites in VA, 9 in PA and 5 in MD. This brings the current total up to 688. In order to achieve the goal we need 117 more by 2010. Goal: 805 by 2010
Goal: 793 by 2005 The new agreement commits to increase the number of designated water trails in the Chesapeake Bay region by 500 miles by 2005. Water Trails in the Bay Region During 2005, 135 new water trail miles were developed. There are currently an estimated 1,804 miles of water trails in the Bay watershed. The goal was achieved ahead of schedule.
Chesapeake 2000 Goal: Stewardship and Community Engagement “Promote individual stewardship and assist individuals, community-based organizations, businesses, local governments and schools to undertake initiatives to achieve the goals and commitments of this agreement.”
The new agreement commits to,beginning with the class of 2005, provide a meaningful Bay or stream outdoor experiencefor every school student in the watershed before graduation from high school. Great Opportunity to Promote Stewardship Ethic But a Significant Challenge to Achieve
What Can You Doto Be a Good Steward andto Help Restore the Bayand its Rivers?
Prevent pollution from entering the Bay and rivers by planting trees, especially along streams and shorelines.
Conserve electricity and water and reduce the amount of miles you drive.
Plant native vegetationthat requires the use of less(or no) fertilizer, pesticides and water.
Limit fertilizer use and apply at appropriate times. • Have your soil tested and ask for recommendations for the best time and amount of fertilizer to apply for your particular landscaping needs. • Never apply more than is needed.
Use safer, nontoxic alternativesfor cleaningand for controlling pests and weeds.
Properly dispose ofhousehold hazardous waste, antifreeze, oil and boat waste.
Get involved with community groups and watershed organizations to developwatershed management plans.