Download
1 / 19
190 likes | 376 Views
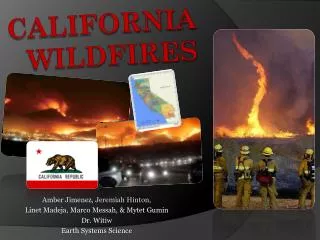
Smoke Impact Forecasting and Emergency Response during the 2008 Northern California Wildfires. Prepared by: Alan C. Chan Sonoma Technology, Inc. Petaluma, CA. Jeffrey Cook California Air Resource Board Sacramento, CA. Trent Procter U.S. Forest Service Region 5 Vallejo, CA.

E N D
Smoke Impact Forecasting and Emergency Response during the 2008 Northern California Wildfires Prepared by: Alan C. Chan Sonoma Technology, Inc. Petaluma, CA Jeffrey Cook California Air Resource Board Sacramento, CA Trent Procter U.S. Forest Service Region 5 Vallejo, CA Timothy Brown Desert Research Institute Reno, NV Presented at the National Air Quality Conference Dallas, TX March 2-5, 2009 3544
Outline • Introduction • Background of project • Temporary monitor deployment • Smoke impact forecasting • How the products were used • Lessons learned • Aftermath Basin Complex 2008 Indians Fire 2008
Introduction (1 of 2) How the season started Much below average precipitation February through June 2008 Radar composite reflectivity at 21:25 on June 20, 2008 Lightning strikes: more than 6,000 from June 20-21, 2008
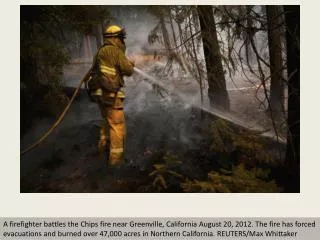
Fires started by lightningin June 2008 Introduction (2 of 2) Summary of fires • 1 million+ acres burned • 2,000+ individual fires burning at the same time • 25,000+ firefighters • Thousands of tons of PM2.5 emitted each day • Millions of people affected by smoke • Unhealthy to Hazardous AQI levels observed (ozone and PM2.5)
Background of Project (1 of 2) Emergency Smoke Response Systems (ESRS) • Motivation: Fires and widespread regional air quality impacts were expected to continue for weeks or months • Purpose: • Assess smoke impact • Support fire management and incident command teams • Resources for air quality agencies Smoke on July 11, 2008
Background of Project (2 of 2) • Elements: • Website • High-resolution smoke modeling • Photochemical modeling • Enhanced air quality monitoring • Human-prepared daily smoke forecasts • Fire impacts analyses • Visualization tools Smoke Dispersion Modeling
Temporary Monitor Deployment(1 of 2) • Purpose • Supplement existing air quality network to assess wildfire impacts • Focus on areas of Northern California with sparse monitoring coverage • Type of samplers • Mobile – surrogate for portable and network monitors • Portable/EBAMs – automated, hourly averages; some data sent to EPA AIRNow in real time Portable: 5+ USFS 7 CARB Trinity, Humboldt, Del Norte Counties
Temporary Monitor Deployment(2 of 2) Real-time data stream to EPA AIRNow and AIRNow-Tech Mobile monitors Hourly PM2.5 concentrations in ug/m3 Late July 2008 Early June 2008
Experimental Smoke Forecast for California Issued Tuesday, September 9, 2008, 1200 PDT (excerpt) Northern California (North Ops): Smoke Dispersion and Fire Overview: Monday’s Observations: Peak PM2.5 concentrations yesterday were 50 µg/m3 at 0800 PDT at Unit 73 at Somes Bar in western Siskiyou County and 65 µg/m3 at 1100 PDT at Unit 1012 located in western Shasta County. Tuesday: The fires that will generate most of the smoke are the Panther fire located in Siskiyou County, the Elmore Fire in western Shasta County, and the Gulch fire in eastern Trinity County. PM2.5 concentrations at 1000 PDT this morning were below 35 µg/m3 throughout the Northern Ops region. However, increased fire activity will produce moderate smoke impacts near existing fires. Low impacts are also expected in Humboldt, Del Norte, Trinity, Siskiyou, and Shasta Counties.............................. Weather Overview: Tuesday: An upper-level low-pressure system over northern California will enhance mixing across northern California. At the surface, light to moderate onshore flow will enhance dispersion across the Sacramento Valley. In the coastal mountains of northern California, winds will be light, leading to reduced smoke dispersion. In the Sierra, the winds will be westerly through-out much of the day.(cont’d) Smoke Impact Forecasting (1 of 6) Products • Text discussions and graphics for North and South operations • Website display
Smoke Impact Forecasting (2 of 6) Hourly PM2.5 concentrations Information used to create forecasts • Diurnal fire and air quality information • Visible satellite images • Webcams • Surface and upper-level pressure patterns Tehipite Fire
Smoke Impact Forecasting (3 of 6) Information used to create forecasts • Mixing heights • Inversion strength • Transport winds • Drainage flow • Upslope flow Wind prediction from CANSAC 1.33km MM5 model CMAQ PM2.5 prediction
Smoke Impact Forecasting (4 of 6) • Challenges/Solutions • Complex meteorology, terrain, and smoke impact: Technically trained forecasters through Cooperative Program for Operational Meteorology, Education and Training fire weather modules • Diverse user community: Explored target audience progressively throughout the fire season (iterative process, moving target) • Multiple goals and uses of final products: Created draft daily map and forecast discussions • Quick response: Issued initial product within three weeks of request • Changing needs: Adjusted forecast products and release timing throughout the fire season to suit audience feedback Complex terrain in Northern California
Smoke Impact Forecasting (5 of 6) Evolution of graphical products
Smoke Impact Forecasting (6 of 6) • Final Version • 5-panel graphic depicting daytime/nighttime smoke impacts • Maps with concentrations added for smoke impact level, including new legend for defining concentration and smoke impacts • 12-hr forward trajectories at 50 m agl
How the Products were Used (1 of 2) California Air Resources Board used graphic in news release on August 18, 2008 (http://www.arb.ca.gov/newsrel/nr062308b.htm).
How the Products were Used (2 of 2) North Coast Unified Air Quality Management District Further, the forecasting assistance ... was extraordinarily useful in assisting District staff in issuing public service advisories, air quality alerts, and hazardous air quality alerts. It provided concise synopses of the forecasted smoke conditions in the District, in a readily accessible format.
Lessons Learned • Rapid deployment of focused ESRS is possible and useful in severe fire weather situations. • Sustainability of the program relies on regular communication with stakeholders. • A well-defined target audience for product dissemination is key. • Be prepared and flexible for rapidly changing conditions and needs. • Knowledge of micro-meteorology and availability of high-resolution meteorological models are vital to smoke impact forecasting.
Aftermath • California Air Response Planning Alliance (CARPA) Summit outreach and emergency response personnel to discuss air quality issues during air emergencies • Increased participation of Northern California air quality agencies in AIRNow • Fire Impact Potential (FIP) analysis • System now in place for next fire season