Download

1 / 17
170 likes | 191 Views
Latest results on the comparison between OMI and ground-based data at two European sites (Rome and Villeneuve d’Ascq) Virginie Buchard, Colette Brogniez, Frédérique Auriol

E N D
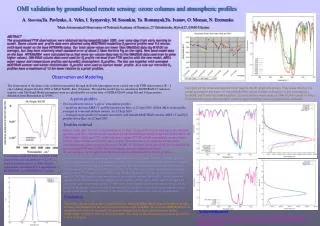
Latest results on the comparison between OMI and ground-based data at two European sites (Rome and Villeneuve d’Ascq) Virginie Buchard, Colette Brogniez, Frédérique Auriol Laboratoire d'Optique Atmosphérique (LOA/CNRS), Université des Sciences et Technologies de Lille, 59655 Villeneuve d’Ascq, FRANCE. Iolanda Ialongo, Anna Maria Siani, Giuseppe Rocco Casale Physics Department, SAPIENZA University of Rome, P.le A. Moro 2, 00185 Rome, ITALY. 25 June 2008 OMI - meeting
OUTLINE • Presentation of the Villeneuve d’Ascq station • Results of the comparison between OMI and ground-based Ozone and UV data at Villeneuve d’Ascq • Presentation of the Rome station • Results of the comparison between OMI and ground-based Ozone and UV data at Rome
Measurements of UV and O3 at VILLENEUVE D‘ASCQ (VdA) LOA - University of LILLE (50.61°N, 3.14°E, 70 m a.s.l.) UV Spectroradiometer : Spectral irradiance measurements on a horizontal surface Double monochromator JOBIN-YVON HD10 Resolution: ~ 0.75 nm – thermally regulated range = 280-450 nm, step = 0.5 nm Scan duration: ~ 6 min – every 15 min Alternately : global (diffuse + direct) and diffuse Uncertainties : ~ 5% (400 nm) – ~8% (300 nm) • Erythemal Dose Rate (EDR) • Total ozone: Differential absorption technique (comparison between 2 ratios of irradiances at 2 wavelengths, one ratio simulated and stocked in a LUT, the other calculated from UV measurements). Uncertainties ~ 3% (clear skies) to 7% depending on the cloudiness • Aerosol optical thickness (AOT) is obtained from the ground-based direct irradiance (global - diffuse), Uncertainties : ~ 0.05 at SZA about 40° ~ 0.03 at SZA about 70°
Comparison of Daily Mean Total Ozone at VdA Daily averages for SZA < 75° Period : October 2005 - February 2007 Collection 3 DOAS TOMS - like DOAS - like + + + 670 points + + + 687 points All skies Good agreement … clear days Seasonal effect : SZA effect Stronger for DOAS (same as collection 2)
Comparison of UV spectral irradiances at overpass time at VdA (1) Deconvolution of the measurements by the instrument’s slit function (FWHM ≈ 0.75 nm) and reconvolution by the FWHM of OMI ≈ 0.55 nm. For clear skies (flags OMI and spectro) 324.1 nm 380.1 nm Period : October 2005 - February 2007 Only few points Excellent correlation • bias at 324 nm OMI > spectro At 380 nm : slope 1 Larger differences for low irradiances
Comparison of UV spectral irradiances at overpass time at VdA (2) 324.1 nm 380.1 nm + + +SZA > 65° (low irradiances) Weak correlation between relative differences and aerosols (AOT)
Comparison of EDR at overpass time at VdA Period : October 2005 - February 2007 Dependence with COD + + + 723 points Cloud Optical Depth at 360 nm : OMI UV algorithm Weak correlation between relative differences and aerosols (AOT) Bias (OMI > spectro)
Clear skies Comparison of EDD at VdA Period : October 2005 - July 2006 + + + 349 points Bias (OMI > spectro) Bias 15% for clear skies
Summary of the OMI validation results at VdA • Ozone data: good agreement for both methods (little better for TOMS method), seasonal effect for DOAS-method. • UV spectral irradiance : satisfying agreement at 324 nm (bias about 6.5%) and 380 nm (bias at small irradiances). • Weak correlation between relatives differences and AOT. • Erythemal dose rates : bias OMI>spectro. • Large relative differences for large COD. • Weak correlation between relative differences and AOT. • Erythemal daily doses : bias OMI>spectro even by clear skies (about 15 %).
Brewer spectrophotometer 067 (model MKIV) Broad-band radiometer (model YES UVB-1) Erythemal Dose Rate (EDR) Erythemal Daily Dose (EDD) (Webb et al., 2006) Measurements of O3 and UV at ROME Sapienza - University of Rome (41.9°N, 12.5°E, 75 m a.s.l.) Total ozone Spectral irradiances (290-325 nm) Erythemal Dose Rate (EDR) AOD at 320.1 nm (Sellitto et al., 2006) SSA/Absorbing AOD at 320.1 nm
Comparison of Daily Mean Total Ozone at ROME Brewer Direct Sun measurements (standard deviation < 2.5 DU) Brewer Total Ozone data uncertainty: 1% OMI ozone data: collection 3 Period : September 2004 - December 2006 Period : October 2005 - December 2006 Good agreement
Comparison of UV spectral irradiances at noon at ROME Brewer measurements have been deconvoluted from the instrument slit function (FWHM 0.63 nm) and convoluted with the triangular OMI slit function (FWHM 0.55 nm). Brewer UV data uncertainty: 5% Period : September 2004 - July 2006 305.1 nm 324.1 nm 310.1 nm
Comparison of EDR at noon at ROME Period : September 2004 - July 2006 Brewer YES UVB radiometer Positive bias OMI > ground Langley plot derived AOD at 320.1 nm AOD uncertainty: 0.04 Only at SZA>55° r>0.4
Comparison of EDD at ROME Period : September 2004 - July 2006 YES UVB radiometer Positive bias OMI > ground
Role of absorbing aerosols on OMI UV estimates at ROME Brewer Irradiances at 324.1 nm EDR Correlation between relatives differences and AOD at 320.1 nm: 0.40-0.56 Absorbing AOD at 320.1 nm derived according to Bais et al. (2005) AAOD uncertainty: 10% Absorbing aerosol free atmosphere: bias=4-7%
Summary of the OMI validation results at Rome AS: All skies CS: Clear skies - The aerosols (especially the absorbing aerosols)could affect the UV OMI-ground bias • Further causes of uncertainty in UV comparison: • atmospheric conditions at overpass time could not correspond to conditions at solar noon: estimated magnitude of changes in atmospheric transmission can reach 50% • the Rome station atmospheric conditions may be not representative of the OMI pixel area (13x24 km2)
Thank you! Contact: Virginie Buchard (buchard@loa.univ-lille1.fr) Iolanda Ialongo (iolanda.ialongo@uniroma1.it)