Download
1 / 18
180 likes | 267 Views
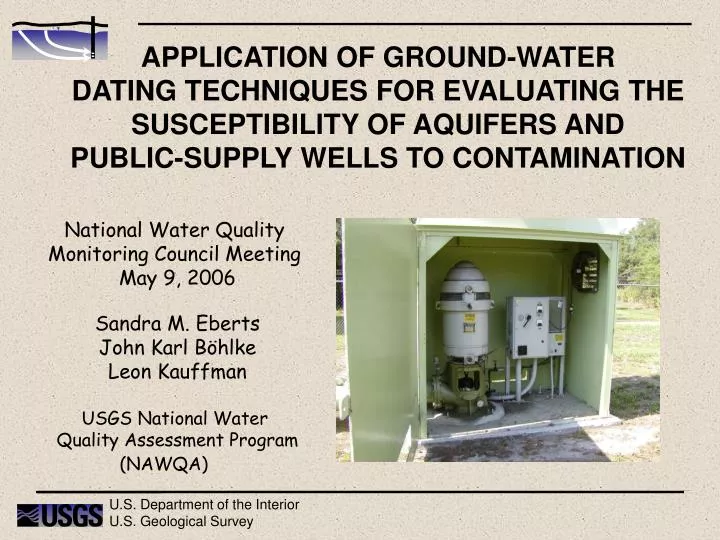
APPLICATION OF GROUND-WATER DATING TECHNIQUES FOR EVALUATING THE SUSCEPTIBILITY OF AQUIFERS AND PUBLIC-SUPPLY WELLS TO CONTAMINATION. National Water Quality Monitoring Council Meeting May 9, 2006 Sandra M. Eberts John Karl Böhlke Leon Kauffman USGS National Water

E N D
APPLICATION OF GROUND-WATER DATING TECHNIQUES FOR EVALUATING THE SUSCEPTIBILITY OF AQUIFERS AND PUBLIC-SUPPLY WELLS TO CONTAMINATION National Water Quality Monitoring Council Meeting May 9, 2006 Sandra M. Eberts John Karl Böhlke Leon Kauffman USGS National Water Quality Assessment Program (NAWQA) U.S. Department of the Interior U.S. Geological Survey
TALK OUTLINE • USGS NAWQA Transport of Anthropogenic & Natural Contaminants (TANC) to Supply Wells Study • Considerations For Interpretation Of Environmental-Age Tracers In Public-Supply Wells • Tracer Concentrations & Age Distributions In Selected Aquifers And Public-Supply Wells
GROUND-WATER DATING STUDY AREAS Glacial deposits High Plains aquifer Floridan aquifer system Central Valley aquifer system Rio Grande aquifer system Edwards-Trinity aquifer system Transport of Anthropogenic and Natural Contaminants (TANC) to Supply Wells Study
Preliminary – Subject to Revision 7 yrs 1,1,1 trichloroethane cis-1,2 dichloroethene trichloroethene tetrachloroethene MTBE freon-11 arsenic uranium 5 yrs bromoform chloroform tetrachloroethene nitrate atrazine DEA diuron arsenic uranium chloroform trichloroethene arsenic uranium 20 yrs cis-1,2 dichloroethene trichloroethene tetrachloroethene nitrate arsenic uranium APPARENT AGES MAY NOT BE SUFFICIENT TO FORECAST SUPPLY WELL SUSCEPTIBILITY 25 yrs Glacial deposits Central Valley High Plains High Plains Floridan
SELECTED ENVIRONMENTAL TRACERS USED TO INFER GROUND-WATER AGE Age: Time Elapsed Since Recharge ToThe Water Table • Tracer-Based Ages Are Apparent Ages • Tracer-Based Ages Are Model Dependent Cook and Böhlke, 2000
a Zuber, 1986 AGE INTERPRETATION-- Piston Flow Model Assumption -- aPFM = piston-flow model A water sample is a mixture of waters from all flow lines that reach the sampling point. If the flow lines are associated with a narrow range of ages, the apparent age of the sample may reasonably represent the travel time from the point of recharge.
a AGE INTERPRETATION-- Lumped Parameter Models for Ground-Water Mixtures -- aPFM = piston-flow model b, c, d EM = exponential model eEPM = exponential piston- flow model Additional models LM = linear LPM = linear-piston DM = dispersion Lumped-parameter models … simple mathematical functions that describe age distributions for various combinations of recharge area, aquifer geometry, and sample type (Zuber, 1986) bc e d
Piston Flow Exponential Mixing Binary Mixing AGE INTERPRETATION-- Tracer Plots -- • Can Be Used To Recognize Cases Of Piston Flow And Binary Mixing With Tracer Free Fraction (Dilution) • Elimination Of Some Mixing Models Modified from Plummer, written commun., 2006
Preliminary – Subject to Revision AGE INTERPRETATION-- Flow Model Calibration and Simulation of Age Distributions -- SF6 Flow-WeightedParticle Tracking: 4.14 pptv Supply-WellSample: 4.53 pptv 3H Flow-WeightedParticle Tracking: 1.98 TU Supply-WellSample: 2.1 TU Floridan Aquifer SystemPublic-Supply Well Crandall, written commun., 2006
AGE DISTRIBUTIONS IN GROUND WATER MIXTURES-- Implications for Susceptibility -- 0.20 Fraction of Sample 0.10 Water Samples With Identical Mean Ages 0.00 0 10 20 30 Age, In Years TRACERMODEL3 (Böhlke, 2006)
Preliminary – Subject to Revision 0.25 Floridan 0.20 0.15 0.10 0.05 0.00 0 10 40 80 30 50 60 70 90 20 100 FLORIDAN AQUIFER SYSTEM-- SIMULATED AGE DISTRIBUTION IN SUPPLY WELL -- 0.35 Recharge to Well, In Percent Age, In Yrs BINARY MIXTURE: Piston Flow (v. young) and Exponential Piston Flow (older) Crandall, written commun., 2006 Not to Scale
Preliminary – Subject to Revision Surficial Aquifer Shallow Upper Floridan Confining Unit Piston Flow Model Binary Mixing Model Exponential Mixing Model Exponential Piston Flow ModelxP/xE = 15 Samples Deep Upper Floridan FLORIDAN AQUIFER SYSTEM -- AGE TRACER DATA -- 5.0 4.0 Public Supply Well 3H, TU 1.0 0.0 0.0 0.2 0.6 3H/3H(0), TU 1.0 0.8 TRACERMODEL1b; http://water.usgs.gov/lab/
Preliminary – Subject to Revision Central Valley CENTRAL VALLEY AQUIFER SYSTEM-- SIMULATED AGE DISTRIBUTION IN SUPPLY WELL -- 0.07 0.06 0.05 0.04 Recharge to Well, In Percent 0.03 0.02 0.01 0 0 50 350 100 150 200 250 300 Age, In Yrs Exponential Piston Flow Burow, written commun., 2006 Not to Scale
Preliminary – Subject to Revision Piston Flow Model Binary Mixing Model Exponential Mixing Model Exponential Piston Flow ModelxP/xE = 0.6 Samples CENTRAL VALLEY AQUIFER SYSTEM -- AGE TRACER DATA -- 6.0 5.0 Public Supply Well SF6, pptv 1.0 0.0 0.0 0.2 0.6 0.8 1.0 3H/3H(0), TU TRACERMODEL1b; http://water.usgs.gov/lab/
Preliminary – Subject to Revision 0.25 0.20 0.15 0.10 0.05 0.00 GLACIAL DEPOSITS-- SIMULATED AGE DISTRIBUTION IN SUPPLY WELL -- Recharge to Well, In Percent 0 10 30 40 50 60 70 80 90 20 100 Age, In Yrs Glacial deposits BINARY MIXTURE:Exponential ( v. young) and Piston Flow (older) Starn, written commun., 2006 Not to Scale
Preliminary – Subject to Revision Piston Flow Model Binary Mixing Model Exponential Mixing Model Exponential Piston Flow ModelxP/xE = 3.0 Samples GLACIAL DEPOSITS -- AGE TRACER DATA -- 25. 20. Public Supply Well 3H, TU 0.0 0.0 0.2 0.6 0.8 1.0 3H/3H(0), TU TRACERMODEL1b; http://water.usgs.gov/lab/
Preliminary – Subject to Revision 72 gal/min 660 gal/min 1,600 gal/min 0.25 0.20 0.15 0.10 0.05 0.00 0 0 10 10 20 30 40 50 60 70 80 90 40 50 60 70 80 90 20 30 100 100 Glacial deposits COMPARISON OF SIMULATED AGE DISTRIBUTIONS IN SUPPLY WELLS Apparent Age: 3H/3He;7 Yrs Recharge to Well, In Percent Central Valley 0.25 0.20 Apparent Age: 3H/3He; 38 yrs SF6 25; Yrs 0.15 Age, In Yrs 0.35 0.10 Floridan 0.25 0.05 Apparent Age: 3H/3He;4 Yrs SF6; 6 Yrs 0.20 0.00 0.15 0 10 20 30 40 50 60 70 80 90 100 0.10 0.05 0.00
CONCLUSIONS • Age Distributions Are More Useful Than Apparent Mean Ages For Understanding Susceptibility • Ground-Water Flow Models Calibrated To Age Tracer Concentrations Can Be Used To Simulate Age Distributions • It May Be Possible To Describe Age Distributions In Public-Supply Wells Using Lumped-Parameter Models (Simple Mathematical Functions) • Tracer-Tracer Plots Can Sometimes Provide Insight Into Age Distributions In Public-Supply Wells http://oh.water.usgs.gov/TANCweb/NAWQATANC.htm