ECONOMIC GEOGRAPHY
430 likes | 445 Views
Explore the spatial organization of economic activities, impacts of decisions and technology shifts globally. Learn about the uneven distribution of wealth, core-periphery dynamics, and the impacts of globalization on various regions. Understand the historical context of industrialization, imperialism, and the Cold War era. Gain insights into current economic systems, transnational corporations, and poverty challenges worldwide.

ECONOMIC GEOGRAPHY
E N D
Presentation Transcript
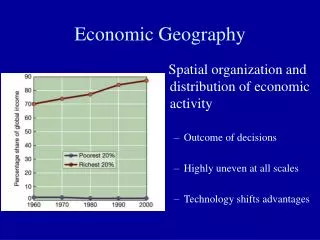
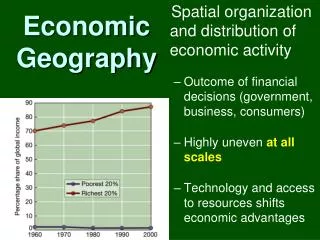
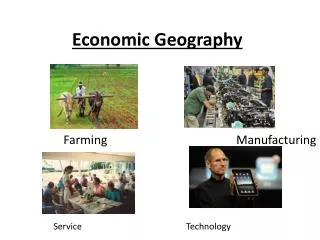
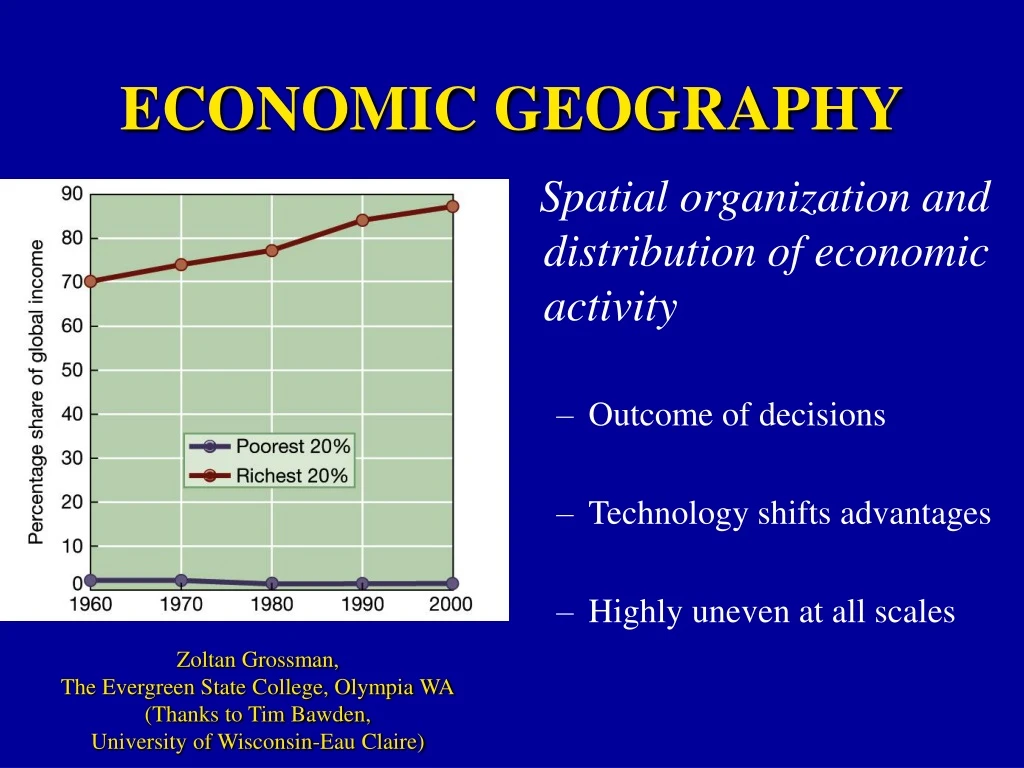
ECONOMIC GEOGRAPHY Spatial organization and distribution of economic activity • Outcome of decisions • Technology shifts advantages • Highly uneven at all scales Zoltan Grossman, The Evergreen State College, Olympia WA (Thanks to Tim Bawden, University of Wisconsin-Eau Claire)
Place in Economic Geography • Where goods, labor, services come from • As economies expand … • they stitch together places • they create global interdependency • Principles of Location • Raw materials, Labor supply and cost, Processing costs, Markets, Transport costs, Government policies, Human behavior
“Fixes” to capital overaccumulation (David Harvey) • “Temporal fix” (shift over time) • Debt, borrowing, investments, planning, etc. • “Spatial fix” (shift over space) • Some capital is immobile; fear of high surplus • Geographical expansion to enlarge/absorb capital, labor • “Fixes” to crisis in capitalism • “Shell game” destroys old, creates new socio-economic landscape
Uneven nationally U.S. poverty (red dots)
Uneven globally U.N. Human Development Index ( life expectancy, education, income)
Uneven globally Per capita GNP (Gross National Product) ( Total value spread evenly in population)
World-System An interdependent system of countries linked by economic and political competition
World-systems processes(Immanuel Wallerstein) • CORE • Industrialized capitalist countries (US, EU, Japan, Aus.) • Often former colonial powers; centers of trade, tech, productivity • Extract resources, labor from the Periphery & Semi-Periphery • PERIPHERY • Poorer countries and regions (Africa, Latin America, S./S.E. Asia) • Former colonies; export resources and labor power • Exploited by Core & Semi-Periphery • SEMI-PERIPHERY • Countries with mixed processes (S. Afr., Brazil, Mexico, Four Tigers) • “Developing”; both exporters and importers of goods, labor • Exploited by Core, but also exploits Periphery
Results of World-System • The growth and strength of the Core is made possible by the exploitation of the rest of the world. • The “poverty” in the Periphery is made possible by the exploitation by the rest of the world (How Europe Underdeveloped Africa by Walter Rodney) • Recent globalization has widened, not narrowed, the gap between Core and Periphery countries (& regions within).
Globalization is nothing new(Flows of goods, labor, capital, information)
Industrial Revolution • Early-1800s • Britain (Hearth) --from slave cotton • Textiles, steam power, iron, canals • Mid-1800s • Diffusion to Germany, France, Belgium • Steel, railroads, steamships, telegraph • Late-1800s/ early-1900s • Spread to much of Europe, US, Japan • Electricity, oil, engines, roads, radio
Britain France Spain Portugal Netherlands Germany Russia U.S. Japan Italy DirectImperialism, 1914
Geography Implicatedin Imperialism • Ethnocentrism and racism • Biological justification of colonialism • Environmental determinism
Imperialism: Spheres of Influence Core dominated, but not controlled, trade and resources China, Iran, Thailand, Saudi Arabia, etc. British opium war in China; seizure of Hong Kong
Anti-colonial revolts • Colonial flags come down • Asia, 1940s-1950s, Africa 1960s-1970s • “Neocolonialism” continues • Ex-colonial powers still dominate economies, resources, cultures
Cold War, 1949-1989 • US-USSR “hot wars” fought in Periphery • Periphery states competed for aid • Arms race depleted global social resources
Enlargement of Soviet bloc after World War II Berlin Wall, 1961-89
World divisions during Cold War • First World - Industrialized capitalist countries of Western Europe, North America. • Second World - Centrally-planned “socialist” countries such as Soviet Union. • Third World - Ex-colonial nations such as India, Malaysia, Iran, Brazil, etc. • “Fourth World” - Poorest nations(and indigenous communities)
North Atlantic Treaty Organization (NATO) Kosovo military zones since 1999
European Union euro Began as European Economic Community (EEC), 1957. Stronger in 1994 Expansion to east, 1990-2007
Transnational corporations • Investments, activities transcend borders • Subsidiaries in many Periphery/S-P countries • Core domination, centralization outside state structure Cartoon on Standard Oil, 1904
Shift to “North/South” divisions • Poor countries tend to be located in Global South(though some have pockets of wealth) • World Bank estimates more than 1.3 billion people (1/5 world population) live in acute poverty of < $1 (U.S.) per day. • 70% women and children • Self-sustaining poverty
Regions of the “World Village” In a world village of 1,000: • 333 East Asians • 274 South Asians • 132 Africans • 120 Europeans • 86 Latin Americans • 50 North Americans • 5 from Oceania
Household income • Average annual income $4,890 • 600 poor • 300 marginal • 100 well-off
Ownership/consumption • 200 richest villagers own and consume 80% of goods • Other villagers own and consume remaining 20%
Material World: A Global Family Portrait Iceland Guatemala Japan
Pockets of poverty in Core Philadelphia Infant Mortality Red area high than at least 28 “Third World” countries, including: Jamaica Cuba Costa Rica Malaysia Panama Sri Lanka South Korea Taiwan Uruguay Argentina Chile
Threats to the State Corporate globalization The State Ethnic nationalism
Corporate globalization • Governments & elites • Multinational corporations • Global trade/finance agencies • World Bank, IMF, WTO • Communications revolution • Internet aids globalization-from-below
Rise of ethnic nationalism • Soviet, Yugoslav breakups • Minority ethnic groups ending majority “oppression.” • Increased ability to survive as smaller country. • Increased local/ethnic identity can be a reaction to impersonal globalization. • Rise of religious fundamentalism
Mental map of the world • “Cognitive maps” show our perception of a place, from memory only. • Don’t worry about geographic knowledge or artistic skills! DON’T put your name on the map, or show it to others. • Be as accurate as you can about the size, shape, and location of world regions. • Show as much as you possibly can; use all the time available. Be detailed about features, place names, political borders, etc. • If you finish early, write your observations on the back.
Mental map interpretation • Selection of information, details, labels • Omission is as important as inclusion • Proportions of sizes, scales, shapes • Choice of physical or cultural features • Relative placement of features • Influence of personal experience • Influence of media and world events • Effect of core, periphery, semi-periphery