QUALITY FUNCTION DEPLOYMENT
QUALITY FUNCTION DEPLOYMENT. LISTEN VOICE OF THE CUSTOMER First application of QFD was at Mitsubishi, Japan, in 1972 by Dr. Mizuno. In production of mini-vans by Toyota: Reduction startup costs 19 7 7-October 1979-November 1982- April 1984 %20 %38 %61

QUALITY FUNCTION DEPLOYMENT
E N D
Presentation Transcript
QUALITY FUNCTION DEPLOYMENT LISTEN VOICE OF THE CUSTOMER First application of QFD was at Mitsubishi, Japan, in 1972 by Dr. Mizuno. In production of mini-vans by Toyota: Reduction startup costs 1977-October 1979-November 1982- April 1984 %20 %38 %61 First implementation in US in 1984 by Xerox
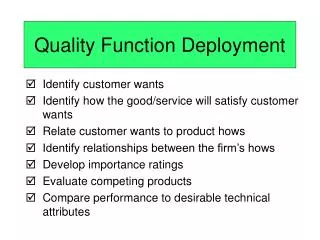
QFD QFD is a planning tool used to fulfill customer expectations. It can be applied to manufacturing and service industries. QFD can improve organization’s engineering knowledge, productivity, and quality and reduce costs, product development time, and engineering changes. Customer expectations directions and actions (specific requirements) (engineering or tech. char.) Deployed through Product planningPart development Process planningproduction planningservice industries
QFD TEAM Types of teams • Designing a new product • Improving an existing product Teams include members from marketing, design, quality, finance, and production Time and inter-team communication
VOICE OF THE CUSTOMER Sources: Focus groups, surveys, complaints, consultants, standards, and federal regulations QFD team analyzes customer expectations into more specific customer requirements Questions: • What does the customer really want? • What are the customer’s expectations? • Are the customer’s expectations used to drive the design process? • What can the design team do to achieve customer satisfaction?
ORGANIZATOIN OF INFORMATION Methods to process the information Affinity diagrams, interrelationship diagrams, tree diagrams, and cause-and-effect diagrams Affinity Diagram • Thoughts are too widely dispersed or numerous to organize • New solutions are needed to circumvent the more traditional ways of problem solving • Support for a solution is essential for successful implementation Steps of constructing an affinity diagram Phrase the objective Record all responses Group the responses Organize groups in an affinity diagram
HOUSE OF QUALITY The goal of the house of quality is to design or change the design of a product in a way that meets or exceeds the customer expectations
A HOUSE OF QUALITY Step 1- List Customer Requirements (WHATs) PrimarySecondaryTertiary Step 2-List of Technical Descriptors (HOWs) QFD team defines the engineering characteristics or technical descriptors which will effect one or more of the customer requirements An expression of the voice of the customer in technical language PrimarySecondaryTertiary
A HOUSE OF QUALITY Step 3-Develop a Relationship Matrix Betwen WHATs and HOWs By structuring an L-shaped diagram, confusion of determining the relationship between customer requirements and technical descriptors can be reduced. Relationship matrix represents graphically degree of influence between each technical descriptor and each customer requirement A solid circle = strong relationship ●=9 A single circle = medium relationship ⃝=3 A triangle = weak relationship =1 Blank box= no relationship
A HOUSE OF QUALITY Step 4-Develop an Interrelationship Matrix Between HOWs Correlation matrix identifies any interrelationships between each of technical descriptors A solid circle = strong positive relationship ●=9 A circle = positive relationship ⃝=3 An X = negative relationship X=-3 An asterisk = strong negative relationship *=-9
A HOUSE OF QUALITY Step 5-Competitive Assessments A pair of weighted tables shows comparison between competitive products and current organization products. • Customer competitive assessment Defines organization stands in competition Determines areas to focus on in the next design 5 for best, 1 for worst • Technical competitive assessment useful in uncovering gaps in engineering judgment 5 for best, 1 for worst
A HOUSE OF QUALITY Step 6-Develop Prioritized Customer Requirements Importance to customer QFD team ranks customer requirements by assigning it a rating. 1 for least important, 10 for very important • Target value QFD team decides to achieve goal 1 for worst, 5 for best • Scale-up factor A ratio of the target value to the product rating given in the customer competitive assessment (TV/CCA)
A HOUSE OF QUALITY Step 6-Develop Prioritized Customer Requirements (Cont.) • Sales point Tells the QFD team how well a customer requirement will sell. 1.0 for lowest, 2.0 for highest • Absolute weight AW=(importance to customer)x (scale-up factor) x (sales point) AW is a guide for the planning phase of the product development.
A HOUSE OF QUALITY Step7-Developed Prioritized Technical Descriptors They are needed to fulfill customer requirements and need improvement • Degree of difficulty Evaluate the ability to implement certain quality improvements • Target value Defines to achieve technical descriptor
A HOUSE OF QUALITY Step7-Developed Prioritized Technical Descriptors (Cont.) Absolute weight Determines the weights by assigning numerical values to symbols in the relationship matrix
A HOUSE OF QUALITY Step7-Developed Prioritized Technical Descriptors (Cont.) Relative weight Higher absolute and relative ratings identify areas where engineering efforts need to be concentrated. These weights show the impact of the technical characteristics on the customer requirements. They can be organized into a Pareto diagram to show which technical characteristics are important in meeting customer requirements
EXAMPLES • Rainstar University QFD is used for meeting customer and accreditation needs • Tennessee Technological University’ College of Business Administration QFD is used for redesign their internal resources center
CONCLUSION Advantages and benefits of implementing QFD • An orderly way of obtaining information and presenting it • Shorter product development cycle • Considerably reduced start-up costs • Fewer engineering changes • Reduced chance of oversights during the design process • An environment of teamwork • Consensus decisions • Everything is preserved in writing