
PRE-ASSESSMENT
E N D
Presentation Transcript
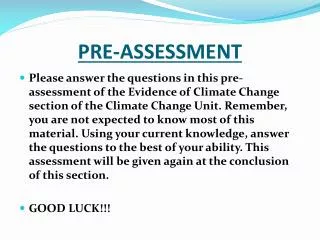
PRE-ASSESSMENT • Please answer the questions in this pre-assessment of the Evidence of Climate Change section of the Climate Change Unit. Remember, you are not expected to know most of this material. Using your current knowledge, answer the questions to the best of your ability. This assessment will be given again at the conclusion of this section. • GOOD LUCK!!!
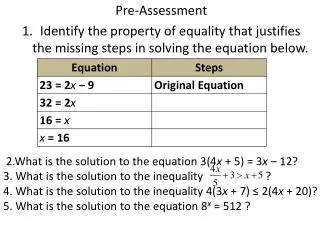
PRE-ASSESSMENT QUESTIONS • Unit: Evidence of Climate Change • Pre-Assessment • Answer the questions below to the best of your knowledge and understanding. Remember, you are not expected to k now all questions at this point. This assessment will be administered again at the end of this unit to measure your understanding of the subject matter. • Name three anomalies in nature that indicate evidence of climate change and briefly explain how each impacts the Earth. • Atmospheric moisture has increased 5% in the past 50 years due to increased global temperatures increasing evaporation rates in the oceans. Some scientists believe this increased moisture could cause increased cloud cover above the surface of the earth thus allowing more of the Sun’s rays to reflect back into space lowering global temperatures. Give a counter argument to this notion using the properties of water vapor as evidence for your counter argument. • Explain how melting sea ice can expedite the rate of global warming while not effecting sea level rise. • Which areas on Earth account for 99% of all surface ice on Earth and explain what effects the melting of these areas would have on global sea levels. • Explain the mechanism that is causing the oceans to become more acidic and describe the possible consequences of an ocean that is more acidic to the atmosphere and to marine ecosystems. • Describe the conditions that produce extreme weather events globally and their impact on the human species by these extreme weather events.
Evidence of Climate Change Warm-Up • Evidence of climate change is all around us and in the news. Can you identify any evidence of climate change? • Choose a partner and “brainstorm” on the evidence that supports the notion that our planet is going through a climate change and give examples. • List your evidence and examples on a piece of paper - try to prioritize by severity with the most severe first. • After 5 minutes – let’s see what we’ve come up with
EVIDENCE OF CLIMATE CHANGE • Global warming of Atmosphere • Ocean Warming • Shrinking Ice Sheets • Glacial Retreat • Declining Arctic Sea-Ice • Sea-level rise • Extreme Weather Events • Ocean Acidification • Loss of Biodiversity
STATE STANDARDS • DE State Science Standard 1: Nature and Application of Science and Technology: • Scientific inquiry involves asking scientifically-oriented questions, collecting evidence, forming explanations, connecting explanations to scientific knowledge and theory, and communicating and justifying the explanation • GLE: • Collect accurate and precise data through the selection and use of tools and technologies appropriate to the investigations. Display and organize data through the use of tables, diagrams, graphs, and other organizers that allow analysis and comparison with known information and allow for replication of results. • Construct logical scientific explanations and present arguments which defend proposed explanations through the use of closely examined evidence
STATE STANDARDS • DE State Standards: • STD 8 – Ecology – • Matter needed to sustain life is continually recycled among and between organisms and the environment. • Illustrate how elements on Earth cycle among the biotic and abiotic components of the biosphere • Organisms and their environments are interconnected. Changes in one part of the system will affect other parts of the system Explain how feedback loops keep ecosystems (at the local and global level) in a state of dynamic equilibrium (e.g., positive and negative feedback loops associated with global climate)
Next Generation Science Standards • HS. Human Sustainability • HS-ESS3-1 – Construct an explanation based on evidence for how the availability of natural resources, occurrence of natural hazards, and changes in climate have influenced human activity • HS-ESS3-6 – Use a computational representation to illustrate the relationship among Earth systems and how those relationships are being modified due to human activity • Amount of carbon dioxide produced and the amount of carbon dioxide sequestered • HS-ESS3-4 – Evaluate or refine a technological solution that reduces impacts of human activities on natural systems • Anthropogenic Carbon sequestration
LESSON OBJECTIVE To identify evidence associated with climate change and evaluate the impactof this evidence on global ecological systems presently and potential future impacts.
CONCEPT/ESSENTIAL QUESTION Concept: Measureable climate change evidence is indicating that global changes in earth systems are impacting all life forms on earth presently and illustrates trends of potential future devastation to earth’s biosphere. Essential Question: If the feedback loop of global warming evidenced on earth today continues to expedite in a positive direction what recourse would humans have when this positive feedback reaches a “tipping point”?
KEY VOCABULARY • Global warming Feedback Loop – the rising temperature on the Earth changes the environment in ways that then create even more heat. Scientists consider feedback loops the single-biggest threat to civilization from global warming. ABC News • Tipping point - the critical point in an evolving situation that leads to a new and irreversible development • Subsidence-the motion of a surface (usually, the Earth's surface) as it shifts downward relative to a datum such as sea-level.
TEMPERATURE PUZZLE VIDEO CLICK PIC
THE EVIDENCE • 1. Global Warming
WHAT IS GLOBAL WARMING? • Global warming is the increase of Earth's average surface temperature due to greenhouse gases, such as carbon dioxide emissions from burning fossil fuels or from deforestation, which trap heat that would otherwise escape from Earth. • Ice cores drawn from Greenland, Antarctica, and tropical mountain glaciers show that the Earth’s climate responds to changes in solar output, in the Earth’s orbit, and in greenhouse gas levels. • Greenhouse gases keep heat close to the earth’s surface making it livable for humans and animals. However, global warming is mainly due to over emitting of large quantities of these gases mostly from fossil fuel burning (natural gas, crude oil, and coal).
SCIENCTIFIC EVIDENCE COLLECTION • The evidence of climate changeis typically obtained from ice cores, analysis of stable isotopes as well as other sediments, temperature profiles of boreholes, sea level records, glacial processes and flora and fauna records.
TAKING EARTH’S TEMPERATURE VIDEO • CLICK PIC
GLOBAL WARMING FACTS • The Earth's climate has changed throughout history. Just in the last 650,000 years there have been seven cycles of glacial advance and retreat, with the abrupt end of the last ice age about 7,000 years ago marking the beginning of the modern climate era — and of human civilization. • Most of these climate changes are attributed to very small variations in Earth’s orbit that change the amount of solar energy our planet receives.
GLOBAL WARMING FACTS • However, today’s global temperature rise does not fit that model but is associated with emissions from the burning of fossil fuels, mainly carbon dioxide. • Temperatures have risen during the last 30 years, and 2000 to 2009 was the warmest decade ever recorded. As the Earth warms up, heat waves are becoming more common in some places, including the United States. • Heat waves happen when a region experiences very high temperatures for several days and nights.
GLOBAL WARMING FACTS • According to the U.S. Global Change Research Program, the atmospheric temperature in the U.S. has increased by 2 degrees in the last 50 years and precipitation by 5 percent. • All three major global surface temperature reconstructions show that Earth has warmed since 1880. Most of this warming has occurred since the 1970s, with the 20 warmest years having occurred since 1981 and with all 10 of the warmest years occurring in the past 12 years.Even though the 2000s witnessed a solar output decline resulting in an unusually deep solar minimum in 2007-2009, surface temperatures continue to increase.
DISPELLING the MISCONCEPTION of SOLAR ACTIVITY ASSOCIATED WITH GLOBAL WARMING
GLOBAL WARMING FACTS • If people keep adding greenhouse gases into the atmosphere at the current rate, the average temperature around the world could increase by about 4 to 12°F by the year 2100. • If we make big changes, like using more renewable resources instead of fossil fuels, the increase will be less—about 2 to 5°F.
MODERN TREND of ATMOSPHERIC CO2 The carbon dioxide data (red curve), measured as the mole fraction in dry air The black curve represents the seasonally corrected data. What causes the spikes in the CO2 graph?
TEMPERATUE CHANGES IN US In most parts of the United States, the average air temperature has increased since the early 20th century. Source: EPA's Climate Change Indicators (2012).
GLOBAL WARMING ACTIVITY • Designing a Global Warming Experiment • Evidence suggests that global warming is a phenomenon that is brought on by an enhanced greenhouse effect due to the build up of greenhouse gasses like CO2, water vapor, and methane in our atmosphere. • AS NASA scientists, you have been given the task of designing an experiment(s) to use as evidence that increased amounts of greenhouse gases in our atmosphere creates an enhanced greenhouse effect which brings on global warming.
GLOBAL WARMING ACTIVITY • Experimental Design • 1. Work in pairs • 2. Components of the experiment • Purpose • Background • Equipment needed • Procedure • Safety precautions • Data collection • Conclusion
GLOBAL WARMING ACTIVITY • Grading Components • 1. Written experiment with all components listed in previous slide. • 2. Diagram of experimental set-up with labels • 3. Predicted outcome (hypothesis) • 4. Data record – temperature readings, gas levels, graphs, etc.) • 5. Conclusion – (compare to hypothesis) • 6. Time: 45 minutes, possible points: 100
DAY 2 – WARM-UP ACTIVITY • Some scientists believe that Arctic Sea Ice may disappear completely by the year 2060. This will open up the Arctic shipping lanes year round and allow ships that used to have to go down to the Panama Canal to just skirt across the Arctic Circle. • Take 10 minutes to list the pros and the cons of this happening. Include environmental as well as economical aspects of the change. • When all have finished, we will see how the rest of the class feels.
THE EVIDENCE-2.OCEAN WARMING The atmosphere affects oceans, and oceans influence the atmosphere. As the temperature of the air rises, oceans absorb some of this heat and also become warmer.
CARBON and the OCEANS VIDEO CLICK PIC
OCEAN WARMING FACTS • Overall, the world's oceans are warmer now than at any point in the last 50 years. The change is most obvious in the top layer of the ocean, which has grown much warmer since the late 1800s. This top layer is now getting warmer at a rate of 0.2°F per decade. • Oceans are expected to continue getting warmer—both in the top layer and in deeper waters. Even if people stop adding extra greenhouse gases to the atmosphere now, oceans will continue to get warmer for many years as they slowly absorb extra heat from the atmosphere.
OCEAN WARMING FACTS • Warmer oceans affect weather patterns, cause more powerful tropical storms, and can impact many kinds of sea life, such as corals and fish. • Warmer oceanic waters is resulting in increased marine diseases and invasive species, changes in weather systems, modifications in species distribution patterns, dead zones and coral bleaching.
OCEAN WARMING FACTS • Larger and more frequent storms are accelerating shoreline erosion, loss of community infrastructure, increased fishing risks and adverse health consequences. • Warmer oceans are also one of the main causes of rising sea level. As water warms it expands and creates more volume. • The surface ocean currently absorbs about one-fourth of the CO2 emitted to the atmosphere from human activities.
OCEAN TEMPS TODAY The surface of the world's oceans has become warmer overall since 1880. In this graph, the shaded band shows the likely temperature range, which depends on the number of measurements and the methods used at different times.
Courtesy NASDA/NASA Courtesy NASDA/NASA GLOBAL OCEAN TEMPERATURES
OCEANS of CLIMATE CHANGE VIDEO CLICK PIC
OCEAN WARMING ACTIVITY • Looking at the Global Ocean Temperature Map, list three places on Earth that would have the highest rate of carbon dioxide absorption and three places that would have the lowest rates of carbon dioxide absorption. • Explain your answers. • Which ocean areas would have the least concentrations of salt and why?
ICE ON EARTH VIDEO CLICK PIC
GLOBAL ICE SHEETS • An ice sheet is a mass of glacial land ice extending more than 50,000 square kilometers (20,000 square miles). The two ice sheets on Earth today cover most of Greenland and Antarctica. • During the last ice age, ice sheets also covered much of North America and Scandinavia. • If the Greenland Ice Sheet melted, scientists estimate that sea level would rise about 6 meters (20 feet). If the Antarctic Ice Sheet melted, sea level would rise by about 60 meters (200 feet).
CONTRIBUTORS TO SEA LEVEL RISE Sea level rise contributors: Comparison of volume (white), area (grey) and percent contribution to sea level rise (red) by small glaciers and ice caps, and the Greenland and Antarctic Ice Sheets. Image courtesy (Meier et al., 2007).
ANTARCTICA and GREENLAND ICE SHEETS • Together, the Antarctic and Greenland ice sheets contain more than 99 percent of the freshwater ice on Earth. • The Antarctic Ice Sheet extends almost 14 million square kilometers (5.4 million square miles), roughly the area of the contiguous United States and Mexico combined. • The Antarctic Ice Sheet contains 30 million cubic kilometers (7.2 million cubic miles) of ice. • The Greenland Ice Sheet extends about 1.7 million square kilometers (656,000 square miles), covering most of the island of Greenland, three times the size of Texas.
SHRINKING ICE SHEETS • The polar ice caps have melted faster in last 20 years than in the last 10,000. A comprehensive satellite study confirms that the melting ice caps are raising sea levels at an accelerating rate. • Ice sheets are retreating. In the years 2002-2006, Greenland lost approximately 150-250 cubic km. of ice every year with Antarctica losing 152 cubic km. between 2002-2005.
EFFECTS OF POLAR ICE MELT • The polar regions are important drivers of the world's climate. When the "everlasting ice" melts at an increasing rate, the rest of the world is affected. • Global sea levels are rising, dark melt-water pools absorb warmth from the sun which white ice would reflect back into space. • Fresh water flows into the sea, changing ocean currents and the living conditions for marine organisms.
ICE MELT AND SEA LEVEL RISE • According to the study, melting ice from both poles has been responsible for a fifth of the global rise in sea levels since 1992, 11 millimeters in all. • The rest was caused by the thermal expansion of the warming ocean, the melting of mountain glaciers, small Arctic ice caps and groundwater mining. • The share of the polar ice melt, however, is rising. • The pattern of change differs considerably between the Arctic and the Antarctic. • Two thirds of the ice loss is happening in Greenland. The rate of ice loss from Greenland has increased almost five-fold since the mid-1990s according to NASA.
GREENLAND ICE MELT EVIDENCE Extent of surface melt over Greenland’s ice sheet on July 8 (left) and July 12 (right). Measurements from three satellites showed that on July 8, about 40 percent of the ice sheet had undergone thawing at or near the surface. In just a few days, the melting had dramatically accelerated and an estimated 97 percent of the ice sheet surface had thawed by July 12. In the image, the areas classified as “probable melt” (light pink) correspond to those sites where at least one satellite detected surface melting. The areas classified as “melt” (dark pink) correspond to sites where two or three satellites detected surface melting. The satellites are measuring different physical properties at different scales and are passing over Greenland at different times. As a whole, they provide a picture of an extreme melt event about which scientists are very confident. Credit: Nicolo E. DiGirolamo, SSAI/NASA GSFC, and Jesse Allen, NASA Earth Observatory›