Download
1 / 37
370 likes | 511 Views
Mercury - overview of global emissions, transport and effects. John Munthe IVL Swedish Environmental Research Institute. Presentation topics. Introduction Emissions Main transport pathways - modelling Contribution of global cycling on deposition in Europe and the USA Monitoring The Arctic

E N D
Mercury - overview of global emissions, transport and effects John Munthe IVL Swedish Environmental Research Institute
Presentation topics • Introduction • Emissions • Main transport pathways - modelling • Contribution of global cycling on deposition in Europe and the USA • Monitoring • The Arctic • Research with hemispherical and/or global focus • Main uncertainties in quantifying the global mercury cycle
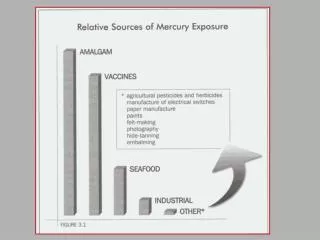
Mercury basics • Natural component of earth´s crust in the form of Cinnabar (HgS) • Global burden increased from natural background by about a factor 3 (air, soils, sediments, fish) • Sources include both intentional use and fuel contamination • UNEP Global Assessment Report and UNEP Governing Council have stated " Mercury is a pollutant of global concern" • Main human impact is via consumption of fish contaminated with methylmercury
Atmospheric mercury speciation • Main form in air is elemental mercury vapour (Hg0) • Is relatively stable towards oxidation and has an atmospheric lifetime of around 1 year • Deposition (dry and wet) is controlled by presence of oxidised gaseous mercury (e.g. HgCl2) and particulate mercury forms. • Oxidised mercury is emitted from some point sources and is also formed in the atmosphere via oxidation (OH, halogens, O3) • Operationally defined mercury species:- RGM = Reactive Gaseous Mercury = Oxidised gaseous mercury, Hg(II)- TPM = Total Particulate Mercury, HgP - GEM = Gaseous Elemental Mercury- TGM = Total Gaseous Mercury = GEM + RGM
Methylmercury • The most toxic form of mercury in the environment • Present in air, water, soils, sediments as a small fraction of the total mercury (0.1 to 5 %) • Bioaccumulates and biomagnifies in aquatic food chains • Methylmercury 90-100% of total mercury in fish • Biotic formation e.g. via methylation of mercury by sulphate reducing bacteria
LAMBORG et al., Geochim. Cosmochim. Acta, 66, 1105–1118, 2002 G.R.I.M.M. All Fluxes in Mmole/y Current Pre-Industrial Air 26 Mmole +17 Hgp 98% Hgº Hgº 2% Hgp Air 8.6 Mmole Hgp 98% Hgº Hgº 2% Hgp Anthropogenic Emissions Deposition Hg2+ Deposition Hg2+ 5 5 12.6 Natural Emissions 3.5 1.9 3.5 10.6 3.4 10.2 Oceanic Evasion Oceanic Evasion Wet & Dry Deposition Wet & Dry Deposition Natural Emissions Hgº CH3Hg+ Hg2+ Hgp Hgº CH3Hg+ Hg2+ Hgp Mixed Layer +26 54 Mmole Mixed Layer 28.5 Mmole Terr. Seds. +318 (58%) 100m 100m 8.6 Particle Removal Particle Removal Upwelling 2.7 Upwelling 3.1 4.6 Thermocline +178 1080 Mmole Thermocline 902 Mmole 1000m 1000m Figure Style Adapted from Mason et al., 1994 Burial 1.7 Burial 1.5 Deep Ocean Seds. +9
Geographical distribution Slide courtesy of Jozef Pacyna, NILU
Emission categories Slide courtesy of Jozef Pacyna, NILU
Speciation of emitted mercury HgP RGM Hg0 Slide courtesy of Jozef Pacyna, NILU
Point source emissions - speciation • Combustion processes emit Hg0, oxidised mercury (RGM) and small fractions of HgP • RGM and HgP will deposit on local to regional scales whereas Hg0 will add to the global background • Measurement methods for speciation exist but are not frequently applied - inventories rely on estimates • Uncertainties in available data on speciation are large
Natural sources and re-emissions • Natural sources believed to be of same order of magnitude as anthropogenic • Main source areas associated with cinnober deposits and other Hg-containing minerals, volcanos • Re-emissions occur from water bodies as well as soils and vegetation • For water surfaces, re-emissions may be of same magnitude as deposition • Uncertainties very large for both natural emissions and re-emissions
oxidation Gas phase Hg(0) Hg(II) Hg(p) oxidation Hg(p) Hg(0) Aqueous phase Hg(II) reduction adsorption to soot Hg(p) Atmospheric chemistry of mercury - schematic description Slide courtesy of Christian Seigneur, AER
Global transport modelling Average elemental mercury surface concentrations for Jan 2001 (ng/m3) GRAHM (Global/Regional Atmospheric Heavy Metals Model) simulation – Ashu Dastoor, Meteorological Service of Canada, Environment Canada
Global transport modelling Average elemental mercury surface concentrations for July 2001 (ng/m3) GRAHM (Global/Regional Atmospheric Heavy Metals Model) simulation – Ashu Dastoor, Meteorological Service of Canada, Environment Canada
Contribution of sources other than U.S. anthropogenic sources to Hg deposition AER/EPRI Modeling System for Atmospheric Mercury Christian Seigneur
Experimental modelling results courtesy of Russell Bullock, US EPA
MSC-East Hemispherical model. Spatial distribution of mean annual concentration of elemental mercury in the surface air of the Northern Hemisphere Travnikov and Ryaboshapko, MSC-E Technical Report 6/2002
Annual deposition field of mercury fromEuropean anthropogenic sources. The red rectangle depicts the EMEP domain Travnikov and Ryaboshapko, MSC-E Technical Report 6/2002
Spatial distribution of annual mercury deposition to the EMEP domain From external anthropogenic and global natural sources From European anthropogenic sources Travnikov and Ryaboshapko, MSC-E Technical Report 6/2002
Relative contributions of differentregions to the entire mercury deposition to Europe. Travnikov and Ryaboshapko, MSC-E Technical Report 6/2002
Contribution of Natural, global and re-emission sources to wet deposition of Hg, 2001 Data from: http://www.msceast.org/ hms/results_relation.html 2005-05-31
Monitoring • Atmospheric mercury is not included in existing global or hemispheric monitoring networks • Mercury monitored at < 10 EMEP stations located in Northern Europe • More extensive networks exist in USA and Canada • Methods have existed for >2 decades, modern automated methods > 5 years
Total Gaseous Mercury at Swedish West Coast 1979 to 2002 Large influence from European emissionsand regional transport Mainly global background
TGM from Mace Head 1991 to 1997 Slide courtesy of Dr Ralf Ebinghaus, GKSS Research Centre (ralf.ebinghaus@gkss.de)
Hg in blood of mothers and women of reproductive age Biomagnification and human exposure Slide courtesy of the Arctic Monitoring and Assessment Programme - AMAP
Mercury Depletion Events - example from Ny Aalesund Slide courtesy of Torunn Berg, NILU (torunn.berg@nilu.no)
Mercury Depletion Events - mechanisms Slide courtesy of the Arctic Monitoring and Assessment Programme - AMAP
Mercury Depletion Events • Large research efforts have been made on mechanisms and occurrence including re-emission from snow pack • Model calculations to estimate net input to Arctic ecosystems - twice expected amount without depletion events • Source of mercury is "Global background"
Mauna Loa, Hawaii Monitoring Site Slide courtesy of Dr Matthew Landis, US EPA (landis.matthew@epa.gov)
Mauna Loa Hg Time Series 2001 “Downslope” Slide courtesy of Dr Matthew Landis, US EPA (landis.matthew@epa.gov)
MBO Okinawa Spring 2004 Experiment: Simultaneous Hg Observations at Mt.Bachelor and Okinawa Slide courtesy of Eric Prestbo Ph.D. (ericp@frontiergeosciences.com) and Professor Dan Jaffe (djaffe@u.washington.edu).
Hg0 vs CO at Okinawa Slide courtesy of Eric Prestbo Ph.D. (ericp@frontiergeosciences.com) and Professor Dan Jaffe (djaffe@u.washington.edu). From: Jaffe D.A, E. Prestbo, P. Swartzendruber, P. Weiss-Penzias, S.Kato, A.Takami, S.Hatakeyama and Y.Kajii. Export of Atmospheric Mercury from Asia. Atmospheric Environment39, 3029-3038, 2005.
Pollutant transport to US west coast from Asia April 25, 2004 Slide courtesy of Eric Prestbo Ph.D. (ericp@frontiergeosciences.com) and Professor Dan Jaffe (djaffe@u.washington.edu)
Current knowledge • Global emission inventory for mercury species • Modelling tools to calculate atmospheric transport and deposition on hemispherical and global scales • Basic understanding of some main chemical processes of atmospheric mercury • Observational evidence of global background mercury levels and influence of regional emissions • Observational evidence of Mercury Depletion Events in the Arctic (and Antarctic) • Observations of transport from Asia to North America
Main uncertainties in quantifying the global mercury cycle • Emission inventories for anthropogenic sources: Needs continuous updating and better information on speciation • Natural emissions: High level of uncertainty. Mainly in the form of Hg0 which mainly influences global background. • Re-emissions: Very high level of uncertainty. Data available only from a few specific sites. Need estimates of e.g. oceanic emissions. • Atmospheric chemistry: Basic facts are known but there are indications of major gaps in e.g. rapid processes in free troposphere
Main uncertainties in quantifying the global mercury cycle • Atmospheric models need continuous updating and testing. • Models need to take into account both a) direct transport - trajectories from source to receptor over shorter time period e.g. from Asia to NA b) additions to/contributions from "global background" which will influence deposition at remote sites and for long time periods • Many current regional models have tendency (or are forced to due to lack of data) to lump or completely ignore natural emissions and re-emissions. This may be acceptable for regional applications but for hemispherical/global applications over longer time periods, better descriptions are needed.