Download
1 / 44
530 likes | 617 Views
Egypt Economy, Banking Sector And Opportunities In SMES. EGYPT MAIN ECONOMIC INDICATORS. 1. WHILE ECONOMIC GROWTH IS 2.2% IN FY 2012, IT’S EXPECTED TO RAMP UP TO 5% BY YEAR 2016. Real GDP Growth. 7,2%. 5,1%. 4,7%. 3,2%. 2,2%. 1,9%. Jun-03. Jun-08. Jun-09. Jun-10. Jun-11. Jun-12.

E N D
WHILE ECONOMIC GROWTH IS 2.2% IN FY 2012, IT’S EXPECTED TO RAMP UP TO 5% BY YEAR 2016 Real GDP Growth 7,2% 5,1% 4,7% 3,2% 2,2% 1,9% Jun-03 Jun-08 Jun-09 Jun-10 Jun-11 Jun-12 Source: CBE,, EIU 2
TRADE BALANCE DEFICIT INCREASED NOTICEABLY AFFECTED MAINLY BY A SURGE IN IMPORTS USD Million Trade Balance Jun-03 Jun-08 Jun-09 Jun-10 Jun-11 Jun-12 Dec-11 * Dec-12 * Source: CBE * 6 months Jul/Dec 3
EXPORT PROCEEDS MAINTAINED THE SAME LEVELS AS 2011, AND EXPECTED TO REACH USD 27.9 BN IN FY 2013 USD Million Export Proceeds 29,356 26,993 26,977 25,169 23,874 Petroleum Exports 14,473 12,136 13,130 11,005 10,259 13,589 13,448 6,739 6,433 Non-Petroleum Exports 14,883 14,857 14,164 13,847 13,615 7,015 6,850 Jun-08 Jun-09 Jun-10 Jun-11 Jun-12 Dec-11 * Dec-12 * Source: CBE, EIU * 6 months Jul/Dec 4
WHILE GOVERNMENT ARE TAKING MEASURES TO CURB IMPORTS ON UNNECESSARY GOODS USD Million Import Payments -5,161 -5,385 Petroleum Imports -6,703 -7,032 -9,262 -9,561 -11,775 -23,802 -23,533 -43,832 -43,310 Non-Petroleum Imports -43,210 -29,187 -44,834 -30,236 -46,899 -48,993 -50,342 -52,771 -54,096 -58,674 Jun-08 Jun-09 Jun-10 Jun-11 Jun-12 Dec-11 * Dec-12 * Source: CBE * 6 months Jul/Dec 5
CURRENT ACCOUNT LARGELY IMPACTED BY TRADE BALANCE WHILE SERVICES SECTORS AND REMITTANCES ARE MAKING NEW HIGHS USD Million Current Account Balance Jun-08 Jun-09 Jun-10 Jun-11 Jun-12 Dec-11 * Dec-12 * Source: CBE * 6 months Jul/Dec 6
2,683 SUEZ CANAL REVENUES CONTINUES NOT TO BE IMPACTED AND TO MAKE NEW HIGHS IN YEAR 2013 USD Million Suez Canal Revenues Jun-03 Jun-08 Jun-09 Jun-10 Jun-11 Jun-12 Dec-11 * Dec-12 * Source: CBE * 6 months Jul/Dec 7
5,061 TOURISM REVENUES IMPROVING, AND EXPECTED TO RECORD USD 11.2 BN IN FY 2013, UP 20% FROM LAST YEAR AND TO REACH PRE-CRISIS LEVELS USD Million Tourism Revenues Jun-03 Jun-08 Jun-09 Jun-10 Jun-11 Jun-12 Dec-11 * Dec-12 * Source: CBE * 6 months Jul/Dec 8
7,899 REMITTANCES OF EGYPTIAN WORKING ABROAD MAKING NEW HIGHS, AND EXPECTED TO RECORD USD 21 BN IN FY 2013 USD Million Remittances of Egyptians Working Abroad Jun-03 Jun-08 Jun-09 Jun-10 Jun-11 Jun-12 Dec-11 * Dec-12 * Source: CBE * 6 months Jul/Dec 9
AS A RESULT, OVERALL BALANCE OF PAYMENTS REDUCED SIGNIFICANTLY TO JUST 0.5 BN IN DECEMBER 2012 IN COMPARISON WITH 8 BN IN DECEMBER 2011 AND 11 BN IN JUNE 2012 USD Million Overall Balance Of Payment Jun-08 Jun-09 Jun-10 Jun-11 Jun-12 Dec-11 * Dec-12 * Source: CBE * 6 months Jul/Dec 10
… STOPPING DRAINAGE ON RESERVES WHICH STARTED TO RISE AGAIN IN APRIL 2013 USD Million Net International Reserves 35,2 34,6 31,3 26,6 15,2 14,8 14,4 13,4 Jun-03 Jun-08 Jun-09 Jun-10 Jun-11 Jun-12 Mar-13 Apr-13 Source: CBE 11
AND WITH LOW FOREIGN DEBT AS LOW AS 16% OF GDP ALLOWS EGYPT TO WEATHER THROUGH ANY CRISIS Total Debt % of GDP 90,5% 86,0% 85,0% 84,5% 83,4% Internal Debt To GDP 74,9% 67,0% 67,1% 67,0% 70,6% External Debt To GDP 19,0% 17,4% 16,4% 15,6% 14,4% 2008 2009 2010 2011 2012 External debt to GDP factoring in the informal sector (around 50% of GDP) can be as low as 10% of GDP Source: Ministry of Finance 12
1,087,819 A VERY RESILIENT BANKING SECTOR, DEPOSITS CAGR REPORTED 8% NOT AFFECTED BY ANY CRISIS EGP Million Aggregate Deposits 1,110,610 +8% 1,023,517 957,037 892,492 809,694 747,199 830,753 778,476 726,940 686,052 598,587 552,079 403,144 LCY 278,179 279,857 245,041 230,097 211,107 206,440 195,120 FCY 124,965 Jun-03 Jun-08 Jun-09 Jun-10 Jun-11 Jun-12 Jan-13 Source: CBE 14
LOANS REPRESENT ONLY 33% OF GDP, WITH AMPLE OPPORTUNITIES TO GROW EGP Million Gross Loans +6% Jun-03 Jun-08 Jun-09 Jun-10 Jun-11 Jun-12 Jan-13 Source: CBE 15
1,441 ASSETS GROWTH OF 6% CAGR MIRRORING GROWTH IN LOANS EGP Billion Total Assets +6% Jun-03 Jun-08 Jun-09 Jun-10 Jun-11 Jun-12 Dec-12 Source: CBE 16
r NPLs ON A DECLINE DUE TO RIGOROUS RISK MANAGEMENT CONTROLS NPLs / Gross Loans 14,8% 13,6% 13,4% 10,5% 9,9% Jun-08 Jun-09 Jun-10 Jun-11 Jun-12 Source: CBE 17
96 PROVISIONING GAP COMPLETELY CLOSED, ESTIMATED TO BE AROUND EGP 102 BN BEFORE THE BANKING SECTOR REFORM (2000-2003) Loan Provisions / NPLs 100,4% 95,7% 95,4% 94,5% 92,5% 92,1% Jun-08 Jun-09 Jun-10 Jun-11 Jun-12 Sep-12 Source: CBE 18
82 PRIVATE SECTOR LOANS CONSTITUTE MOST OF THE LENDING Loans to Private Sector / Total Loans to Customers 83,9% 82,4% 82,4% 82,2% 81,0% 81,0% 80,5% Jun-03 Jun-08 Jun-09 Jun-10 Jun-11 Jun-12 Sep-12 Source: CBE 19
OVER THE PAST FEW YEARS BANKS HAVE DOUBLED THEIR CAPITAL EGP Billion Capital of banking Sector Jun-08 Jun-09 Jun-10 Jun-11 Jun-12 Sep-12 Dec-12 Source: MOF 20
RESULTING IN A WELL CAPITALIZED BANKING SECTOR, TIER 1 CAPITAL TO RISK WEIGHTED ASSETS WAS 13.9% IN SEPTEMBER 2012, ESTIMATED TO BE 15% ON TIER 2 CAPITAL Tier 1 Capital / Risk-Weighted Assets 13,9% 13,6% 13,3% 12,7% 12,0% 11,5% 10,0% Jun-03 Jun-08 Jun-09 Jun-10 Jun-11 Jun-12 Sep-12 Source: CBE 21
58 A VERY LIQUID BANKING SECTOR ON LCY Liquidity Ratio (Local Currency) 57,7% 56,0% 55,6% 44,7% 43,4% 34,5% 31,0% Jun-03 Jun-08 Jun-09 Jun-10 Jun-11 Jun-12 Sep-12 Source: CBE Liquidity ratio is calculated by dividing (cash, surplus in reserves balance held at CBE, cheques, T-bills and bonds and CP) by (due cheques, deposits, due to banks) Minimum liquidity ratio of LCY is 20% 22
55 … AND IN FCY Liquidity Ratio (Foreign Currency) 55,4% 53,9% 51,8% 48,1% 46,8% 41,0% 40,6% Jun-03 Jun-08 Jun-09 Jun-10 Jun-11 Jun-12 Sep-12 Source: CBE Liquidity ratio is calculated by dividing (cash, balance held at CBE, cheques, due from banks, T-bills and bonds issued by FI) by (due cheques, deposits, due to banks) Minimum liquidity ratio of FCY is 25% 23
3,667 NBE MADE REMARKABLE ACHIEVMENTS IN JUNE 2012 , PBT INCREASED BY 46% TO EGP 6.1 BN EGP Million Profit Before Taxes +46% +90% Jun-08 Jun-09 Jun-10 Jun-11 Jun-12 Dec-11 * Dec-12 * * 6 months Jul/Dec 25
5,383 SUPPORTED BY 82% GROWTH IN NET INTEREST INCOME EGP Million Net Interest Income +35% +82% Jun-08 Jun-09 Jun-10 Jun-11 Jun-12 Dec-11 * Dec-12 * * 6 months Jul/Dec 26
321,5 TOTAL ASSETS INCRESED BY EGP 96.4 BN SINCE 2008 TO REACH EGP 321.5 BN IN JUNE 2012 EGP Billion Total Assets +9% 340,7 321,5 306,4 300,0 +5% 259,1 225,1 Jun-08 Jun-09 Jun-10 Jun-11 Jun-12 Dec-12 27
278,8 NBE DEPOSITS INCREASED BY EGP 105.2 BN FROM 2008 UNTIL JUNE 2012 IN COMPARISON WITH EGP 276.3 BN INCREASE IN THE BANKING SECTOR , CAPTURING 38% OF THE GROWTH IN THE MARKET EGP Billion Customer Deposits 286,0 278,8 +13% 261,1 244,7 218,9 173,6 235،1 226,9 210,8 196,3 170,5 131,8 Local 52,0 50،9 50,3 48,4 48,4 41,8 Foreign Jun-08 Jun-09 Jun-09 Jun-11 Jun-12 Dec-12 28
21,2 NBE MADE SETTLEMENTS FOR NON PERFORMING LOANS , WHICH HAVE HAD A NEGATIVE IMPACT ON CAPITAL Settlements for NPL EGP Billion “Cumulative” 23,2 21,2% +44% 18,2 16,0 11,5 4,9 Jun-08 Jun-09 Jun-10 Jun-11 Jun-12 Dec-12 29
6,5 AND DECREASED NON PERFORMING LOANS TO EGP 6.5 BN IN JUNE 2012 COMPARED WITH EGP 23.4 BN IN 2008 EGP Billion NPL 23,4 -27% 21,1 19,9 8,4 6,7 6,5 June 2008 June 2009 June 2010 June 2011 Jun-12 Dec-12 30
13,6 NBE SUCCEDED IN INCREASING EQUITY TO EGP 13.6 BN IN JUNE 2012 COMPARED WITH EGP 7.7 BN IN 2008 EGP Billion Equity 19,1 +15% 13,9 13,6 13,0 10,5 7,7 Jun-08 Jun-09 Jun-10 Jun-11 Jun-12 Dec-12 31
% NBE MODERNIZED THE LOOK AND FEEL OF ITS BRANCH NETWORK 32
1,469 AND INCREASED THE NUMBER OFATMS TO REACH 1,496 MACHINES IN DECEMBER 2012 CAPTURING MORE THAN THIRD OF THE MARKET ATMs +25% Jun-08 Jun-09 Jun-10 Jun-11 Jun-12 Dec-12 33
h FACTS AND FIGURES (1/2) SMES IN EGYPT • As per latest statistics, SMEs are employing 7.5 mn people representing 33.7% of the employed workforce • Increased in GDP contribution over the last ten years from 40% to 70% of GDP • Estimated gap in financing for SMEs around EGP 30 bn in FY 2012 35
5 FACTS AND FIGURES (2/2) SMEs in Egypt SMEs Market Formal Sector Formal Sector10% Unserved Clients40% Informal Sector90% Served by Banks60% Informal Sector SMEs Clients Served by Banks NBE22% Served by NGOs49% Unserved Clients51% Other Banks78% 36
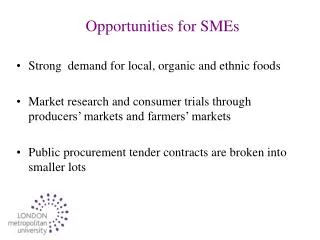
h STRATEGIC IMPORTANCE OF SMES IN EGYPT • Providing new job opportunities to reduce the unemployment rate • Raising social welfare to reduce poverty • Contribution to social, economic and political stability • Supporting innovation and creativity • Providing feeding industries • Promoting real economic growth • Improving country’s trade balance 37
h NBE INITIATIVES TO PROMOTE SMES • Providing more delegation to branches and regions to ensure efficient and timely processes • Providing different products (e.g. Leasing, Factoring, Islamic Finance, Equity Finance) • Launching consultancy and advisory department and call center • Cooperation with donors and external funds in different fields like: Manufacturing, Services and Agriculture (operating 13 fund programs providing about EGP 5 bn) 38
ACCORDINGLY PORTFOLIO DOUBLED IN LESS THAN 3 YEARS NBEs SMEs Portfolio of Performing Direct Loans EGP Billion 8,40 7,70 6,50 5,00 4,50 Jun-10 Jun-11 Jun-12 Dec-12 Mar-13 39
AND CAPTURED 40% OF DIRECT FINANCING NEEDS NBEs Client Share in Terms of Direct Finance Other Banks60% NBE40% 40
AS CLIENTS ACQUISITIONS GREW TO 13.7K IN MARCH 2013 NBEs SMEs Client Acquisition 13.733 +36% 9.728 8.700 6.400 Jun-11 Jun-12 Dec-12 Mar-13 41
h VISION FOR SMES FUTURE • Providing USD 500 mn annually to finance new startups and mature enterprises promoting the creation of 315 k new job opportunities • Establishing an SME council for all parties operating in the field • Unifying SMEs definition across the country • Assisting in the conversion from the informal sector to the formal sector through creation of strong incentive schemes • Developing industrial and rural clusters in addition to incubators and industrial malls • Expanding in Venture Capital • Expanding in credit guarantee schemes • Expanding in technical assistance support programs 42