0.5
(A). (B). 90. 2.5. 80. 2. 70. 60. 1.5. 50. LacZ activity (Units). Relative lacZ mRNA level (fold). 40. 1. 30. 20. 0.5. 10. 0. 0. RK2. ori. RK2. RK2. RK2. pACYC. pACYC. pBR322. pBR322. pACYC. pACYC. pBR322. pBR322. pSC101. pSC101. pSC101. pSC101. pSC101 H.

0.5
E N D
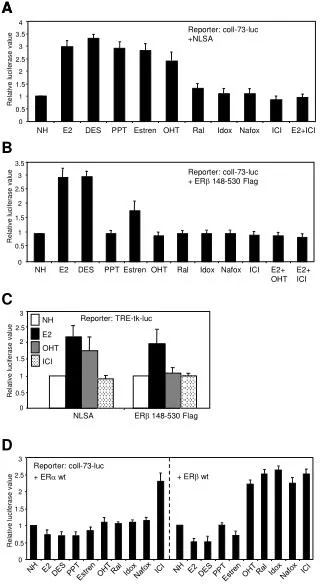
Presentation Transcript
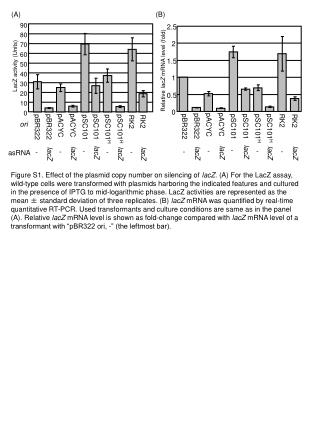
(A) (B) 90 2.5 80 2 70 60 1.5 50 LacZ activity (Units) Relative lacZ mRNA level (fold) 40 1 30 20 0.5 10 0 0 RK2 ori RK2 RK2 RK2 pACYC pACYC pBR322 pBR322 pACYC pACYC pBR322 pBR322 pSC101 pSC101 pSC101 pSC101 pSC101H pSC101H pSC101H pSC101H - - - - - - - - - - asRNA lacZ lacZ lacZ lacZ lacZ lacZ lacZ lacZ lacZ lacZ Figure S1. Effect of the plasmid copy number on silencing of lacZ. (A) For the LacZ assay, wild-type cells were transformed with plasmids harboring the indicated features and cultured in the presence of IPTG to mid-logarithmic phase. LacZ activities are represented as the mean± standard deviation of three replicates. (B) lacZ mRNA was quantified by real-time quantitative RT-PCR. Used transformants and culture conditions are same as in the panel (A). Relative lacZ mRNA level is shown as fold-change compared with lacZ mRNA level of a transformant with “pBR322 ori, -” (the leftmost bar).
180 160 140 120 AckA (Units) 100 80 60 40 20 0 RK2 ori RK2 pACYC pSC101 pBR322 pACYC pBR322 pSC101H pSC101 pSC101H - - - - - asRNA ackA ackA ackA ackA ackA Figure S2. Effect of the plasmid copy number on silencing of ackA. For the AckA assay, wild-type cells were transformed with plasmids harboring the indicated features and cultured in the presence of IPTG to mid-logarithmic phase. AckA activities are represented as the mean ± standard deviation of three replicates.
(B) (A) 40 35 30 pACYC ori araC 25 pHN649 3.9 kb PepN (Units) 20 Pbad 15 Chlr 10 PT-MCS 5 0 ori pACYC pACYC asRNA - pepN (C) rRNAs pepN asRNA - - + arabinose + ori pACYC pACYC - asRNA pepN Figure S3. Silencing of pepN using an arabinose-inducible vector. (A) Arrows indicate open reading frames or promoters, and a circle indicates an ori. Details of pHN649 are described in our previous report (Nucleic Acids Res., 34, e138). The pepN antisense sequence same as described in the body text was inserted into the multiple cloning site (MCS) of pHN649, yielding pHN1365. (B) For the PepN assay, wild-type cells were transformed with plasmids harboring the indicated features and cultured to mid-logarithmic phase. The names of the plasmids used are pHN649 and pHN1365. PepN activities are represented as the mean ± standard deviation of three replicates. Open and gray bars are results with the absence and presence of 0.3% L-arabinose, respectively. (C) The pepN PTasRNA was detected by northern blot (lower panel). The rRNA bands stained with ethidium bromide (upper panel) are shown as loading controls.
0.5 kb AckA (%) Pta (%) yfbV (<1-135) ackA (473-1675) pta (1761-3890) yfcC (4080->4345) WT 100 100 514 1339 DackA N.D. 69 ± 15 3834 1846 Dpta 62 ±12 N.D. 3834 514 DackA Dpta N.D. N.D. Figure S4. The ackA-pta loci of wild-type (WT) and disruptants (DackA, Dpta, and DackADpta) are shown, along with their AckA and Pta activities (% relative to that of WT). N.D. indicates not detected. The disruptants were generated from the WT strain using the “marker-less gene disruption method” (Mol. Microbiol., 5, 1447-1457). Dashed lines are deleted parts.
(A) pACYC ori lacIq ackA pHN1032 4.1 kb pHN1371 Ptrc pta ackA pHN1372 Chlr MCS (+ rescue vector) ori asRNA (C) (B) pBR322 - (+ pHN1032) (+ rescue vector) ori asRNA pSC101H - pBR322 - pBR322 - (+ pHN1032) (+ pHN1372) pSC101H - pBR322- (+ pHN1371) pBR322 ackA (+ pHN1032) pSC101Hpta pBR322 ackA (+ pHN1032) pBR322 ackA pBR322 ackA (+ pHN1371) (+ pHN1372) pSC101Hpta 1000 1000 800 800 600 600 Turbidity (Arbitrary units) Turbidity (Arbitrary units) 400 400 200 200 0 0 2 4 6 8 2 4 6 8 10 12 14 10 12 14 Time (hr) Time (hr) Figure S5. Rescue of growth retardation that is caused by ackA and/or pta PTasRNAs by overexpressing ackA and/or pta genes. (A) The plasmid pHN1032 is an IPTG-inducible vector. Note that it is not a vector for expressing PTasRNAs but is an ordinary expression vector. It was constructed by cloning a 1.5-kb fragment excised from pTrc-99a (Amersham Biosciences Corp.) by digestion with SphI and EcoRI into the SphI-EcoRI moiety of pHN540u (Nucleic Acids Res., 34, e138). The ackA and pta full-length fragments were PCR-amplified using primers (TTCCATGGCGAGTAAGTTAGTACTGGT and GTCTCGAGTCAGGCAGTCAGGCGGCTCGC, and AACTCGAGGAGATATACCATGCTGATCCCTACCGGAACCAGC and GAACTAGTTACTGCTGCTGTGCAGACTGAA, respectively) and the genomic DNA of the MG1655 strain as a template. The ackA fragment was cloned into the NcoI-XhoI moiety of pHN1032, thereby yielding pHN1371. To construct pHN1372, the pta fragment was cloned into the XhoI-SpeI moiety of pHN1371. (B and C) Growth curves of the indicated transformants are shown. The wild-type strain was co-transformed with the PTasRNA vector(s) carrying the indicated features and one of pHN1032, pHN1371, or pHN1372. Then, the co-transformants were cultured in the presence of IPTG.
(A) aggctttacactttatgcttccggctcgtatgttgtgtggaattgtg agcggataacaatttcacacaggaaacagctatgaccatgattacgg attcactggccgtcgttttacaacgtcgtgactgggaaaaccctggc gttacccaacttaatcgccttgcagcacatccccctttcgccagctg gcgtaatagcgaagaggcc Ver. 1 Ver. 2 Ver. 3 Ver. 4 (B) 35 30 25 20 LacZ activity (Units) 15 10 5 0 ori pACYC pACYC pACYC pACYC pACYC - asRNA lacZ ver. 2 lacZ ver. 4 lacZ ver. 1 lacZ ver. 3 Figure S6. Effect of the different asRNA sequence on silencing of lacZ. (A) The partial DNA sequence of lacZ is shown. A boxed nucleotide indicates the transcription start position, and the putative ribosome-binding site and translation start codon are shown in blue and red characters, respectively. Four versions of lacZ asRNA sequences were used to construct PTasRNA expression vectors, and those sequences are underlined with red (version 1), blue (version 2), green (version 3), and magenta (version 4). (B) For the LacZ assay, wild-type cells were transformed with plasmids harboring the indicated features and cultured in the presence of IPTG to mid-logarithmic phase. LacZ activities are represented as the mean ± standard deviation of three replicates.