Exploring Density Trends in Elements: A Comprehensive Lab Report
This lab report outlines the systematic study of density trends among various elements, specifically focusing on Germanium (Ge), Carbon (C), Silicon (Si), Lead (Pb), and Tin (Sn). The report includes pre-lab preparations, data collection methods, graph construction, and error analysis. Detailed calculations concerning density and volume are provided, along with visual data representations. The conclusion discusses findings regarding element densities, determines accuracy through percent error, and reflects on sources of error and future improvements in experimental methods.


Exploring Density Trends in Elements: A Comprehensive Lab Report
E N D
Presentation Transcript
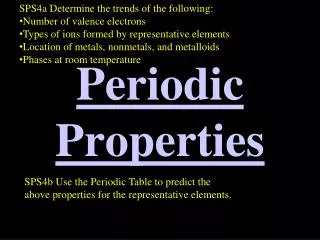
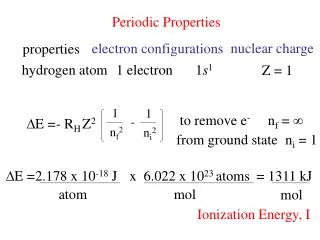
Periodic Properties Unit 5
Density Trend Lab Grading • Pre-lab 9 • Data 1 • Graph 5 • Calc. 6 • % Error 2 • Conc. 7 _____________ • Total 30
Post-Lab Write-Up • Data: 1 Point • Pen (please keep data and observations inside the table!) • Notated changes • Proper Sig. Figs • (I.E. Volume at least 0.1 mL, mass 0.001g) • Graph: 5 Points • Axes/title/ink • Best Fit Line (TO = thru origin) • Interpolating Ge and Extrapolating C (indicate values on y-axis) • Correctly plotted data points (x not .) • Calculations: 6 Points • 2 points for each (Si, Pb, Sn) including volume and density calcs. • Labeled? • Units • Correct sig figs • Percent Error: 2 Points
Conclusion: 7 Points • In your conclusion you should examine the results of your lab. What values did you determine for the densities of Ge and C to be? Give numeric results = 1 • How were you able to determine the densities of these two elements? Discuss density determination and values for Si, Sn and Pb and interpolation and extrapolation used (I/E) = 3 • Were the results close to what they were supposed to be (examine your percent error)? = 1 • Why did you have error in your lab (be specific ex: don’t say inaccurate measurements; what was inaccurate,why?) ; what could you/would you do differently next time? (2 pts) btw, exact mass does not matter