Download
1 / 14
180 likes | 378 Views
Scaling Laws in the Spatial Structure of Urban Road Networks Physica A 363 (1) 89-95, 2006. S. Lämmer, B. Gehlsen, and D. Helbing (2006) Scaling laws in the spatial structure of urban road networks, Physica A 363 (1) 89-95. Scope of Study.

E N D
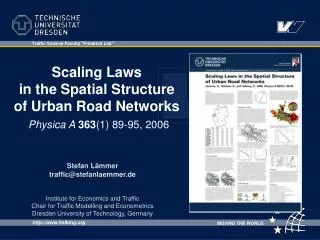
Scaling Laws in the Spatial Structure of Urban Road NetworksPhysica A363(1) 89-95, 2006
S. Lämmer, B. Gehlsen, and D. Helbing (2006) Scaling laws in the spatial structure of urban road networks, Physica A363(1) 89-95. Scope of Study • Urban road network analysisof 20 largest cities of Germany(ranked by population) • Geographical database: Tele Atlas MultiNetTM City of Dresden with 9643 nodes and 22.307 links
Distinct Classes of Networks • Random networks (Erdős and Rényi 1959) • Exponential node-degree distribution • High vulnerability to random failures • Scale-free networks (Barabasi and Albert 1999) • Short distances (small world phenomenon) • High clustering coefficients • Power-law node-degree distribution • Urban road networks (Gastner and Newman 2004) • Mainly planar cellular structure • Limited node-degrees (average strictly less than 6) • Very high network diameter, high redundancy
(a) Link cost proportional to network distance (b) Link cost proportional to Euclidian distance Scale-free network Road network Generating a Road Network • Combinatorial Optimization Problem • Given: node positions and total link length. • Minimize the average length of all shortest paths. Distances are the most fundamental property of road networks!
With a travel-distance-budget of r kilometers, a car driver can reach a neighborhoodof size With a travel-time-budget of τminutes, a car driver can reach a neighborhood of size Dresden: d = 2.2 Scaling of Neighborhood Sizes
Effective Dimension • Computation of effective dimension d: • High values of d imply: • Neighborhoods grow fast by small increases of travel-time budget. • High accessibility of distant places. • Heterogeneous distribution of road speeds, e.g. the city might have an underlying highway system. Typical values for d Berlin 2,330 Bremen 2,220 Hamburg 2,350 Duisburg 2,050 Munich 2,463 Leipzig 2,304 Cologne 2,372 Nuremberg 2,399 Frankfurt 2,388 Dresden 2,205 Dortmund 2,091 Bochum 2,279 Stuttgart 2,008 Wuppertal 2,040 Essen 2,243 Bielefeld 2,337 Düsseldorf 2,700 Bonn 2,134
Spatial concentration of traffic flow • Traffic flows can be estimated by betweenness centrality b, which is the number of shortest paths visiting a link or a node.(We assume homogeneous OD-flows and ignore congestion effects)
Scaling of traffic flow on nodes • High values of β imply: • Traffic flow concentrates on fewhighly important intersections. • Low redundancy (lack of alternative routes) • High vulnerability to failures of traffic control Typical values for β Berlin 1.481 Hamburg 1.469 Munich 1.486 Cologne 1.384 Frankfurt 1.406 Dortmund 1.340 Stuttgart 1.377 Essen 1.368 Düsseldorf 1.380 Bremen 1.351 Duisburg 1.480 Leipzig 1.320 Nuremberg 1.420 Dresden 1.355 Bochum 1.337 Wuppertal 1.279 Bielefeld 1.337 Bonn 1.374
Typical values for g Berlin 0,871 Stuttgart 0,894 Nuremberg 0,854 Hamburg 0,869 Essen 0,892 Dresden 0,870 Munich 0,869 Düsseldorf 0,849 Bochum 0,847 Cologne 0,875 Bremen 0,909 Wuppertal 0,881 Frankfurt 0,873 Duisburg 0,900 Bielefeld 0,872 Dortmund 0,875 Leipzig 0,880 Bonn 0,889 Concentration of Traffic on Road Meters • Lorenz-Curve • High values of Gini-Coefficient gimply • Bundling of traffic on arterial roads • Existence of bottlenecks (bridges) • Reduced traffic (in residential areas) • Distinct hierarchy of roads Half of the total traffic volume is handled by only 3.2% of the road meters. 80% of total traffic volume is concentrated on no more than 10% of all road meters. 50% of all road meters have only 0.2% of the total traffic volume.
Cellular Structures • Distribution of cell-degrees (number of neighboring cells) Road networks Crack patterns Honey combs Dragon fly wings
Scaling of Cell Areas Typical values for α Berlin 1.158 Bremen 0.931 Hamburg 0.890 Duisburg 0.924 Munich 1.114 Leipzig 0.926 Cologne 0.922 Nuremberg 0.831 Frankfurt 1.009 Dresden 0.892 Dortmund 0.803 Bochum 0.829 Stuttgart 0.901 Wuppertal 0.883 Essen 0.932 Bielefeld 0.735 Düsseldorf 0.964 Bonn 1.018 Cells with half the cell area are two times more frequent
Distribution of Form Factors • Form Factor φ: Fraction of the circumscribed circle that is covered by the cell φ=0 … long and narrow φ=1 … compact and round • High values of Var(φ) imply • Irregular network structure, e.g. city has grown over many epochs • Difficult to navigate from car driver’s point of view Var(φ) Berlin 0,159 Hamburg 0,164 Munich 0,159 Cologne 0,165 Frankfurt 0,169 Dortmund 0,166 Stuttgart 0,170 Essen 0,169 Düsseldorf 0,175 Bremen 0,166 Duisburg 0,169 Leipzig 0,153 Nuremberg 0,172 Dresden 0,156 Bochum 0,171 Wuppertal 0,162 Bielefeld 0,161 Bonn 0,173
Conclusions • Scaling of neighborhood sizes • Fast roads let neighborhoods grow fast • Effective dimension of urban space is significantly higher than two(although mainly planar) • Scaling of traffic flow • Estimation of traffic based on betweenness centrality • Power-law distribution of traffic flow on nodes • We found quantitative measuresto characterize concentration of traffic • Scaling of cell areas • Power-law distribution of cell areas • We found quantitative measuresto characterize irregularity of cellular structure
Scaling Laws in the Spatial Structure of Urban Road NetworksPhysica A363(1) 89-95