Download
1 / 44
440 likes | 594 Views
2005 Public Opinion Survey on Education in Indiana. Presented to the Indiana State Board of Education January 4, 2006. Jonathan A. Plucker Terry E. Spradlin Jason S. Zapf Rosanne W. Chien Rose A. Jackson. Center for Evaluation and Education Policy (CEEP).

E N D
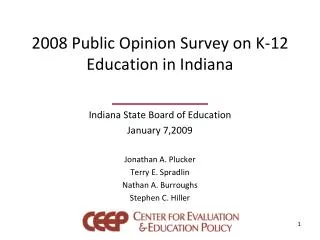
2005 Public Opinion Survey on Education in Indiana Presented to the Indiana State Board of Education January 4, 2006 Jonathan A. Plucker Terry E. Spradlin Jason S. Zapf Rosanne W. Chien Rose A. Jackson
Center for Evaluation andEducation Policy (CEEP) • CEEP promotes and supports rigorous program evaluation and policy research primarily, but not exclusively, for education, human service and non-profit organizations. • In the area of K-12 education policy, CEEP’s mission is to help inform, influence and shape sound policy through effective, nonpartisan research and analysis.
Need for a Survey • No comprehensive, nonpartisan survey of public opinion on Indiana education issues in recent memory • Policymakers in other states find such surveys to be very helpful • CEEP chose to undertake such a survey over three years: 2003-2005 • Year 3 survey conducted to identify changes in the attitudes and perceptions of Hoosiers since 2003 and gauge opinions on K-12 education policy issues likely to be addressed during the 2006 session of the Indiana General Assembly
Telephone Survey • 605 residents of Indiana, all 18+ years old • Conducted in late fall • Random Digit Dialing (RDD) • Includes both listed and unlisted numbers • Minimum and maximum quotas for county, age, gender, and race/ethnicity to ensure a representative sample of these variables • Gender balance reflected 45.1% male, 54.9% female • Race/ethnicity balance reflected: 82.7% white, 7.7% African American, and 3.4% Hispanic • State and regional results are weighted proportionately to the Indiana population for gender and race • Data collection by Stone Research Services
Survey Statistics • Ratio of initial refusals to households successfully screened (2128/1193) was 1.8:1, which is lower than average for RDD samples. • Overall sampling error of +/- 4%
Survey Development • Questions developed from a review of: • Surveys in other states (CA, DE, AL) and the ISTA poll • 37th Annual Phi Delta Kappa/Gallup Poll of the Public’s Attitudes Toward the Public Schools • Issues being discussed by Indiana policymakers • Anticipated “hot topics” in Indiana (e.g., school funding, ISTEP+ testing, vouchers, and the achievement gap)
Item Revision • 2003-2005 Survey questions have been reviewed by: • Project staff • Indiana policymakers and educational leaders representing a breadth of perspectives and ideologies • Stone Research Services
Public School Quality • 56% of Hoosiers say that public schools in Indiana provide an excellent or good education v. 37% fair or poor • 55% (Excellent/Good) v. 42% (Fair/Poor) with school-aged children • 57% v. 34% without school-aged children • Only 54% of Central IN residents rate schools excellent or good; lowest among the three regions of the state 2003 2005 2004
Public School Quality by Race/Ethnicity • 59% of white respondents indicated that public schools in Indiana provide an excellent or good education v. 35% fair or poor • 45% of non-white respondents rated public schools as excellent/good v. 49% fair/poor Non-white White 2003
Local School Quality • 64% say their public schools provide an excellent or good education v. 30% fair or poor • 63% (excellent/good) v. 33% fair/poor with school-aged children • 64% v. 28% without school-aged children • 66% v. 29% in Northern Indiana 2005 2003 2004
Local School Quality by Race/Ethnicity • 66% of white respondents say their public schools provide an excellent or good education v. 29% fair or poor • 53% (excellent/good) v. 40% fair/poor for non-white respondents Non-white White 2003
School Quality Over Past 5 Years • 32% say that public schools have gotten better in the past 5 years v. 16% worse • 31% (better) v. 20% (worse) with school-aged children • 33% v. 13% without school-aged children • 36% of males say schools have gotten better v. 29% of females 2003 2004 2005
Teacher Quality • 69% rate the quality of public school teachers as excellent or good v. 28% who rate teacher quality as fair or poor • 67% (excellent/good) v. 32% (fair/poor) with school-aged children • 70% v. 26% without school-aged children • Northern Indiana 70% v. 26% 2005 2003 2004
Is Public School Funding Sufficient? • 32% of residents believe funding for public schools is enough v. 62% not enough • 31% (enough) v. 65% (not enough) with school-aged children • 33% v. 60% without school-aged children • Central IN residents most likely to view schools as underfunded (65%) • More non-white residents (78%) than white residents (59%) view schools as underfunded 2003 2004 2005
Options for Ensuring a Balanced Budget • 53% of Hoosiers supported a combination of cutting spending, raising taxes, and an efficient government to balance the budget • 34% favored making government more efficient • 6% favored cutting spending • 3% favored raising taxes 2004 2005
Reductions in K-12 Spending • 19% would support reductions in K-12 spending v. 77% who would not • Reflects a 16 percentage point increase from 2004 in those who would not support K-12 spending cuts 2004 2005
Paying for Public Schools • Raise taxes to increase school funding: • Willing: 59% • Not willing: 37% • Indiana residents with higher income and educational attainment more likely to support a tax increase • Central IN residents more willing to support a tax increase (65%) 2003 2004 2005
Expenditures on Facilities & Equipment • Majority of Hoosiers (43%) believe facilities and equipment spending is sufficient • 20% believe expenditures are far too much or more than sufficient • 18% believe expenditures are less than sufficient or far too little 2004 2005
P-16 Questions Pre-School and Kindergarten Issues Drop-Out Age/Rate Issues
Pre-School for At-Risk Children • 78% of residents indicated support for state funded pre-school for at-risk children • 84% of those with school-aged children indicated support v. 74% without school-aged children
Mandatory Kindergarten • 83% of Hoosiers think kindergarten should be required for all students. • 95% of non-white residents indicated support compared to 81% of white residents • Northern Indiana indicated greatest regional support (85%)
Full-Day Kindergarten Implementation • Majority of Indiana residents (53%) support state funded, mandatory FDK for schools and students • Non-white respondents indicated greatest support for state funded, mandatory FDK for schools and students: • Non-white: 70% • White: 51%
Full-Day Kindergarten Funding • 61% of respondents would support FDK if taxes had to increase to support it • 67% of those with school-aged children indicated support v. 58% without school-aged children • 77% of non-white respondents indicated support compared to 60% of white respondents 2003 2004 2005
High School Drop-out Rate a Significant Issue • 89% of Hoosiers indicated that the HS drop-out rate is a significant issue • 92% of respondents between the ages of 18-34 strongly agreed or agreed • 92% of non-white respondents also strongly agreed or agreed
Raising High School Drop-out Age • 75% of respondents favored raising the high school drop-out age • 81% of those earning less than $35,000 indicated support, compared with 72% of those earning greater than $75,000 • 87% of non-white respondents indicated support. 2004 2005
Withhold Driver’s License or Work Permit for Dropouts (ages 14-18) • 67% of residents supported withholding driver’s licenses or work permits for dropouts • Those with less education indicated greater support: • HS or less: 72% • College grad or more: 61% • Non-white respondents indicated greater support: • Non-white: 74% • White: 66% 2004 2005
Hoosiers Somewhat or Very Familiar With … 2003 2004 2005
ISTEP+ and School Performance • 73% of Indiana residents believe ISTEP+ has improved schools to some extent v. 20% not at all • 76% strongly agreed or agreed that ISTEP+ helps hold schools accountable for student achievement • 71% strongly agreed or agreed that ISTEP+ gives parents helpful information about a school’s performance • 16% favored fall administration of the ISTEP+, while 70% favored spring administration 2003 2004 2005
Favor Use of Vouchers • 48% of Hoosiers favor the use of vouchers if a public school has been placed on probation or identified as needing improvement; 44% do not • 54% of those with school-aged children indicate support; only 45% of those without school-aged children • 73% prefer vouchers for both public and private schools; 12% favor private school vouchers only
Favor Creation of Charter Schools • Half of Indiana residents favor the creation of additional charter schools • However, 27% opposed the creation of additional charter schools, compared with 19% in 2004 • Over half (54%) of male respondents favored the creation of additional charter schools, compared to 47% of female respondents 2003 2004 2005
Hoosiers That Know a Great Deal or Some About … 2004 Indiana 2003 Indiana 2005 Indiana 2005Nationally
Impact of Federal Government Involvement on School Performance • 31% of respondents indicated that federal government involvement was helping improve schools – down from 43% in 2003 2003 2004 2005
Judging School Performance • 78% of Hoosiers favor using a combination of fixed standards and improvement in number of students passing the ISTEP+ to judge school performance
Importance of Achievement Gap • 94% of respondents indicated closing the achievement gap is very or somewhat important • Non-white respondents indicated greater agreement that issue very important: • Non-white: 78% • White: 65% 2005 Indiana 2004 Indiana 2005Nationally
Cause of Achievement Gap • 78% of Hoosiers believe that the achievement gap is due to factors other than schooling, such as family income or parental educational attainment • Non-white and white respondents differ regarding the attribution to factors other than schooling: • White: 80% • Non-white: 60% 2005 Indiana 2004 Indiana 2005Nationally
Closing the Achievement Gap • 52% of Indiana residents believe it is the public schools’ responsibility to close the achievement gap; 40% believe it is not 2005 Indiana 2004 Indiana 2005Nationally
Methods for Closing the Achievement Gap 2005 Indiana 2004 Indiana
Conclusions • Indiana adults generally have a positive attitude about public schools and teachers. • Hoosiers are even more likely to view the schools in their own community favorably. • However, citizens see room for improvement. • Hoosiers perceive that public schools are under-funded and the level of spending affects the quality of education students receive.
Conclusions • Indiana residents would not support reductions in K-12 funding and are more inclined in 2005 than in 2003 to support tax increases to fund public education programs (including full-day kindergarten). • There is a growing awareness about the federal accountability law (NCLB), but less awareness about PL 221; and no significant change in the level of awareness over the three years with charter schools and vouchers. • Citizens want efforts made to improve low performing public schools before student transfers are initiated. Among those familiar with tuition vouchers, a large majority preferred that the vouchers be used in both public and private schools rather than strictly in private schools.
Conclusions • Hoosiers believe that ISTEP+ holds schools accountable for student achievement, has improved the quality of Indiana schools, and provides parents with meaningful information. • Based on what they know, respondents believe ISTEP+ tests should be given in the spring.
Conclusions • A range of P-16 initiatives are generally supported, such as voluntary pre-school for at-risk students, mandatory kindergarten, full-day kindergarten, and increasing the drop-out age to 18. • Hoosiers believe that it is important to close the achievement gap. They also believe that the gap is caused by societal factors, but believe that schools should address this issue. Increased parent participation and more instructional time are viewed as the best strategies to close the achievement gap.
2006 Survey • CEEP will explore continuation of the Public Opinion Survey on Education in Indiana beyond the initial three year plan. • If continued, questions will continue to be reviewed and refined.