Download
1 / 24
240 likes | 349 Views
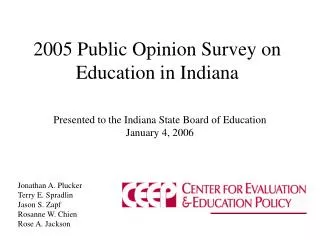
2003 Public Opinion Survey on Education in Indiana. Released January 26, 2004 Presented to the Indiana Education Roundtable March 9, 2004. Jonathan A. Plucker Molly A. Chamberlin Jason S. Zapf Ada B. Simmons. Center for Evaluation & Education Policy.

E N D
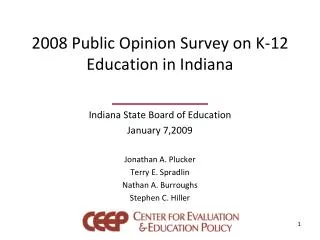
2003 Public Opinion Survey on Education in Indiana Released January 26, 2004 Presented to the Indiana Education Roundtable March 9, 2004 Jonathan A. Plucker Molly A. Chamberlin Jason S. Zapf Ada B. Simmons Center for Evaluation & Education Policy
Center for Evaluation andEducation Policy (CEEP) • Resulted from the merger of the: • Indiana Education Policy Center (IEPC) • Indiana Center for Evaluation (ICE) • Mission is to provide nonpartisan research support to Indiana policymakers as they craft education policy
Need for a Survey • No comprehensive, nonpartisan survey of public opinion on Indiana education issues in recent memory • Policymakers in other states find such surveys to be very helpful • CEEP chose to self-fund such a survey over three years: 2003, 2004, 2005
Telephone Survey • 1,001 residents of Indiana, all 18+ years old • Conducted in late fall 2003 • Random Digit Dialing (RDD) • Includes both listed and unlisted numbers • Minimum and maximum quotas for county, age, and gender to ensure a representative sample on these variables • Data collection by Stone Research Services
Survey Statistics • Ratio of initial refusals to completed interviews is 2.3:1, lower than average for RDD samples. • Overall sampling error of +/- 3%
Item Creation • Items drawn from: • Surveys in other states • National surveys • Issues being discussed by Indiana policymakers • Anticipated “hot topics” in Indiana
Item Revision • Each question was reviewed by: • Several project staff • Indiana policymakers representing a breadth of perspectives and ideologies • Stone Research Services
Public School Quality • 55% of Hoosiers say that public schools in Indiana provide an excellent or good education vs. 40% fair or poor • 59% v. 38% with school-aged children • 61% v. 36% in So. IN
Local School Quality • 62% say their public schools provide an excellent or good education vs. 32% fair or poor • 66% v. 31% with school-aged children • 69% v. 28% in So. IN
Quality Over Past 5 Years • 32% say that public schools have gotten better in the past 5 years vs. 15% worse • 34% v. 16% with school-aged children
Public School Funding • Funding for public schools is: • Enough: 31% • Not enough: 59% • 24% v. 69% with school-aged children
Paying for Public Schools • Raise Taxes to Raise School Funding? • Willing: 49% • Not willing: 45% • “Willing” favor sales tax, but preferences vary widely by demographic group
Knowledge of Core 40 • 52% reported knowing about Core 40 • 48% reported not knowing about Core 40
Favor Core 40 to Receive Aid? • Asked only of the 52% who reported knowing about Core 40 • 65% Favor • 27% Oppose
Favor Mandatory8th Grade Algebra? • 60% Favor • 36% Oppose
Favor Mandatory Kindergarten? • Participants informed that 90-94% of children attend kindergarten in Indiana • 81% Favor • 18% Oppose
Full-day or Half-Day Kindergarten? • Poll conducted before FDK became hot button issue • 46% FD v. 47% HD • Subsequent Indy Star poll found greater support: 56% vs. 36% • 704 people, +/- 3.7% • Asked about optional FDK
Hoosiers Somewhat or Very Familiar With … 77% 55% 37% 39% 40%
Hoosiers That Know a Great Deal or Some About … Nothing: 38% Nothing: 71% 35% 16% (little difference if parent of school-aged child)
Conclusions • Indiana adults generally have a positive attitude about public education, although they see room for improvement. • A range of P-16 initiatives are generally supported. • Results suggest that public awareness is very low for some P-16 and reform initiatives, very high for others.
2004 Survey • We will continue to refine questions. • Will seek input June-July 2004 • We hope to release 2004 results the first week of the 2005 legislative session. • We will include several new analyses: • Trend data (2003-2004) • Comparisons to national and other state surveys • Crosstabulations