Download
1 / 12
120 likes | 135 Views
This text explores the concepts of speed and velocity, and how to calculate and describe motion using graphs. It also introduces the SI units for speed and provides examples and activities to reinforce learning.

E N D
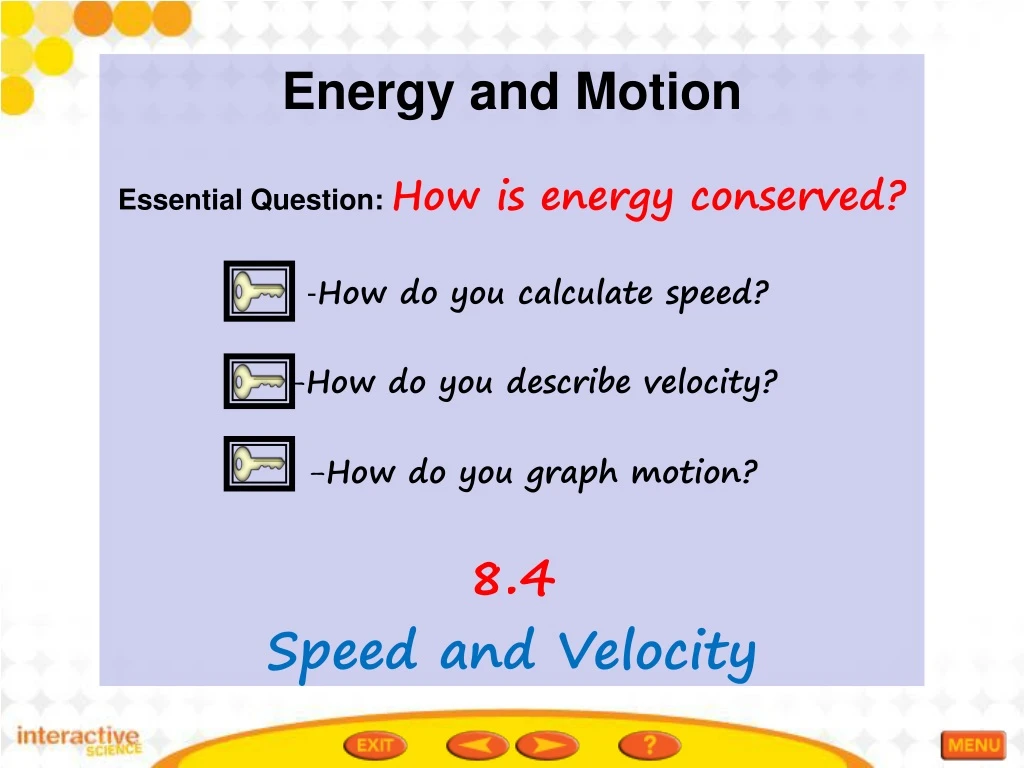
Energy and Motion • Essential Question: How is energy conserved? • -How do you calculate speed? • How do you describe velocity? • How do you graph motion? • 8.4 • Speed and Velocity
Vocabulary 8.4 • Speed--The distance an object travels per unit of time. • Average Speed--The overall rate of speed at which an object moves • Speed= Distance (total distance an object travels ) • Time (total time) • instantaneous speed-- The speed of an object at one instant of time. • Velocity– Latin word = velox meaning “swift” Speed in a given direction. • Slope-- The steepness of a graph line; the ratio of the vertical change • (the rise) to the horizontal change (the run). • Slope= Rise • Run
Calculate Speed pg. 307 • The speed of an object is the distance the object moves per unit of time. • How would you describe the motion of an airplane?? • we can say it moves fast!! • How about the motion of a snail? • The motion would be reallllllllllllllllllllly slow!! (pg. 307 last P.) • Speed is a type of rate. (rate tells you the amount of something that occurs or changes in specific time) • To calculate the speed of an object divide the distance the object travels by the amount of time it takes to travel that distance. • Distance • Speed equation: Speed= Time
SI units for speed pg. 307 • The SI unit for speed is meters per second= m/s • *The slash / is read as “per” • Plane= travels at a constant speed of 260 m/s= • Explain what this means to you…. • This means that a plane travels a distance of 260 meters per 1 sec. • Space shuttle reaches a speed of 28,000 kph • Are these SI units? • How far does the shuttle travel in one hour at that speed?
Pearson Interactive Activity • Pearson Interactive Activity
Instantaneous Speed pg. 308, 309 • Average Speed--The overall rate of speed at which an object moves (r. • To calculate the average speed (The overall rate of speed at which an object moves)of an object, divide the total distance traveled by the total time. • Average speed equation: • Speed= Distance(total distance an object travels) • Time (total time) • Instantaneous speed is the speed at which an object is moving at a given instant in time. • A moving object’s speed may change. • The SI unit for speed is m/s, or meters per second.
Figure 1--Speed and Velocity pg. 308 • Use the data from all three legs to solve for each triathlete’saverage speed. • CLUE (average Speed= Distance (total distance) • Time(total time)
How Do You Describe Velocity? Pg. 310 • When describing an object’s motion, you need to know both its speed and its direction. • Example: Thunderstorm speed 25 km/h • Is it imp. To know in which direction is traveling???? • When you know both the speed and direction of an object’s motion, you know the velocity of the object. • Speed in a given direction is velocity.
How Do You Graph Motion? Pg. 312 • You can show the motion of an object on a line graph in which you plot distance versus time. • Time is shown on the x-axis (the horizontal axis) • Distance is shown on the y-axis (the vertical axis). • Each point on the line represents the distance an object has traveled during a particular time. • The steepness of a line on a graph is its slope.
How Do You Graph Motion? Pg. 312 • The slope tells you how fast one variable changes in relation to the other variable in the graph. • In other words, slope tells you the rate of change. • Since speed is the rate at which distance changes over time, the slope of a distance-versus-time graph represents speed. • To calculate the slope of a line, divide the rise (vertical change between two points) by the run (horizontal change between the same two points). • Slope= Rise • Run
Figure 4--Speed and Velocity pg. 312 Constant Speed The graph shows the motion of a jogger. What is the jogger's speed? ___________________ On the same graph, draw a line that represents the motion of a jogger that moves at a constant speed of 100 m/min.
Figure 5 Speed and Velocity pg. 313 Changing Speed The graph shows how the speed of a jogger varies during her second day of training. Find the rise, the run, and the slope for each segment of the graph?