
100
10000. 10000. C. D. 1000. 1000. Number of CDS. 100. 100. 10. 10. 1. 1. 0.02. 0. 0.06. 0.08. 0.10. 0.12. 0.18. 0.20. 0.22. 0.24. 0.26. 0.28. 0.30. 0.04. 0.14. 0.16. 2400. 2600. 2800. 200. 400. 600. 1000. 2200. 2000. 800. 1200. 1400. 1600. 1800. 3000.

100
E N D
Presentation Transcript
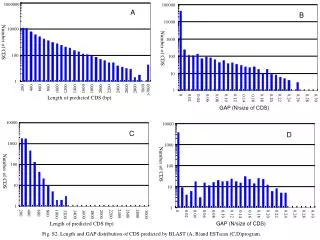
10000 10000 C D 1000 1000 Number of CDS 100 100 10 10 1 1 0.02 0 0.06 0.08 0.10 0.12 0.18 0.20 0.22 0.24 0.26 0.28 0.30 0.04 0.14 0.16 2400 2600 2800 200 400 600 1000 2200 2000 800 1200 1400 1600 1800 3000 GAP (N/size of CDS) Length of predicted CDS (bp) 100000 1000000 B A 10000 Number of CDS Number of CDS Number of CDS 10000 1000 100 100 10 1 1 0.02 0 0.06 0.08 0.10 0.12 0.18 0.20 0.22 0.24 0.26 0.28 0.30 0.04 0.14 0.16 200 400 600 800 1000 1200 1400 1600 1800 2000 2200 2400 2600 2800 3000 >3000 Length of predicted CDS (bp) GAP (N/size of CDS) Fig. S2. Length and GAP distribution of CDS predicted by BLAST (A, B)and ESTscan (C,D)program.


