Download
1 / 32
320 likes | 334 Views
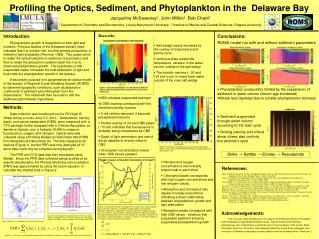
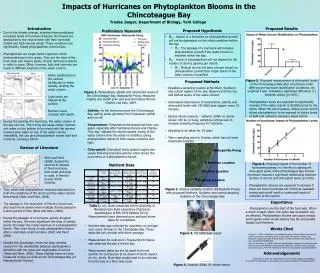
Test the hypothesis that suspended sediment limits light and suppresses growth in the highly eutrophied Delaware Bay. Use an idealized 2-D estuary model coupled with a nitrogen ecosystem model and sediment transport model. Study the turbidity maximum and observe hydrographic transects, chlorophyll concentrations, and absorption rates.

E N D
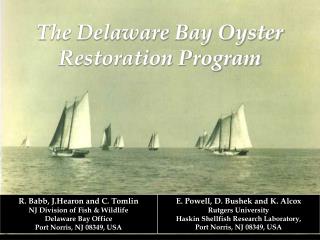
An idealized model of sediments, nutrients, phytoplankton and optics in the Delaware Bay John L. Wilkin Institute of Marine and Coastal Sciences Rutgers, the State University of New Jersey with Jacqueline McSweeney (RIOS student, LMU), Bob Chant, Dove Guo, Maria Aristizabal, Eli Hunter (Rutgers), Chris Sommerfield (U. Delaware), John Warner and Chris Sherwood (USGS)
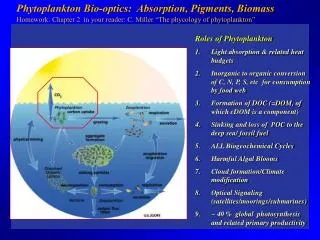
Delaware Bay and River Highly eutrophiedNO3 > 50 mmol m-3 but no extreme primary productivity: phytoplankton remain below “nuisance levels.” Paradigm is that suspended sediment limits light and suppresses growth. Test this hypothesis using an idealized 2-D estuary model (ROMS) with a nitrogen ecosystem model (Fennel) and sediment transport model (CSTM) coupled through the bio-optical absorption (PAR). Estuarineturbiditymaximum
Hydrographic transects of observed salinity and suspended-sediment concentration (mg liter-1) in the Delaware Estuary Cook, T., C. Sommerfield, and K. Wong (2007), Observations of tidal and springtime sediment transport in the upper Delaware Estuary, Estuarine, Coastal and Shelf Science, 72(1-2), 235-246.
Temperature (color) and salinity (contours) during June 2010. McSweeney, J., J. Wilkin, and R. Chant, “Profiling the Optics, Sediment, and Phytoplankton in the Delaware Bay,” Research Internships in Ocean Sciences (RIOS), Rutgers University, 2010
Chlorophyll (color), optical backscatter (contours), and PAR (red profiles) during June 2010. High chlorophyll regions occur upstream and downstream of two turbidity maxima.
Nitrogen, oxygen,chlorophyll and absorption at 4 m depth 150 100 50 40 30 20 10 0 2.0 m-1 Nitrogen and oxygen concentration (µM) Chlorophyll concentration (µg/L) 50 0 0.5 m-1 river distance (km) McSweeney, J., J. Wilkin, and R. Chant, “Profiling the Optics, Sediment, and Phytoplankton in the Delaware Bay,” Research Internships in Ocean Sciences (RIOS), Rutgers University, 2010
PAR (photosynthetically active radiation) measured with profiling radiometer. (Integration across 6 wavelengths 412 nm to 660 nm.) McSweeney, J., J. Wilkin, and R. Chant, “Profiling the Optics, Sediment, and Phytoplankton in the Delaware Bay,” Research Internships in Ocean Sciences (RIOS), Rutgers University, 2010
Time-series data from the New Castle mooring Cook, T., C. Sommerfield, and K. Wong (2007), Observations of tidal and springtime sediment transport in the upper Delaware Estuary, Estuarine, Coastal and Shelf Science, 72(1-2), 235-246.
Salinity versus distance for all Delaware Estuary surface samples from 1978–2003. Sharp, J., K. Yoshiyama, A. Parker, M. Schwartz, S. Curless, A. Beauregard, J. Ossolinski, and A. Davis (2009), A Biogeochemical View of Estuarine Eutrophication: Seasonal and Spatial Trends and Correlations in the Delaware Estuary, Estuaries and Coasts, 32(6), 1023-1043.
ROMS model: “2-D” depth/along-axis (3 grid points across) 20 s-levels, Δx = 750 m. Similar to “ESTUARY_TEST” River Q = 100 m3 s-1 utide = 0.7 m s-1 salt depth (m) sand_01 initial = 0 in suspension= 0.5 m in bed wsettle = 2 mm s-1 Erate= 5 x 10⁻⁴ kg m-2 s-1 τcrit= 0.2 Pa sand 0 km 150 km
salt wedge salt at t = 40 days depth (m) Estuarine Turbidity Maximum (ETM) sand at t = 40 days 0 km 150 km
Control case: Run 13 Suspended noncohesive sediment in model (kg m-3) time = 40 days Suspended Sediment Concentration observed (mg liter-1)
Control case: Run 13 Suspended noncohesive sediment in model (mg liter-1) time = 40 days Suspended Sediment Concentration observed (mg liter-1)
Schematic of ROMS “Bio_Fennel” ecosystem model PAR absorption is modified by modeled suspended sediment concentration: Att(x,z) = AttSW + AttChl*Chlorophyll(x,z,t) + AttSed*Sed(x,z,t) [Chl:C]*[C:N]*Phyt
Concentrations of nitrogen species along estuary axis for July 1986. NO3 NH4 Sharp, J., K. Yoshiyama, A. Parker, M. Schwartz, S. Curless, A. Beauregard, J. Ossolinski, and A. Davis (2009), A Biogeochemical View of Estuarine Eutrophication: Seasonal and Spatial Trends and Correlations in the Delaware Estuary, Estuaries and Coasts, 32(6), 1023-1043.
Chlorophyll concentrations in Delaware Bay • Pennock, J. (1985), Chlorophyll distributions in the Delaware estuary: regulation by light-limitation, Estuarine, Coastal and Shelf Science, 21(5), 711-725.
Att(x,z) = AttSW + AttChl*Chlorophyll(x,z,t) + AttSed*Sed(x,z,t) slope = 75 m-1 (kg m-3)-1 is sediment specific attenuation coefficient (AttSed in ROMS) Attenuation coefficient (k) vs. suspended sediment from a multiple regression on in situ observations of PAR (from profiling radiometer), suspended sediments (filtration), chlorophyll (fluorometer), and DOC. Pennock, J. (1985), Chlorophyll distributions in the Delaware estuary: regulation by light-limitation, Estuarine, Coastal and Shelf Science, 21(5), 711-725.
slope = 250 m-1 (kg m-3)-1 is sediment specific attenuation coefficient (AttSed in ROMS) Beam attenuation coefficient (cp) vs. suspended particulate mass (SPM) from observations using LISST and DFC at MVCO. Hill, Paul, E. Boss, J. Newgard, B. Law, T. Milligan: Observations of the sensitivity of beam attenuation to particle size in a coastal bottom boundary layer, unpublished manuscript, ONR OASIS Project
1% lightlevel salinity contours chlorophyll day 40 NO3 day 40 suspended sediment contours
PAR distribution along estuary axis (for nominal surface Io = 400 W m-2) Observed June 2010 I(z) = Ioe-1 1% lightlevel ROMS model day 40 Distance along estuary axis (km)
Test hypothesis on sediment/optics control on photosynthesis: Disable sediment optics feedback by setting AttSed = 0 No sediment light limitation, yet much less chlorophyll ?
Average primary productivity (mmol N m-3 day-1) mean over 40 days of simulation
Average primary productivity (mmol N m-3 day-1) mean over last 10 days of simulation
Mean denitrificationmmol N m-2 day-1 Mean primary production mmol N m-2 day-1 Distance (km)
Summary (1) 2-D depth/along-axis model of idealized Delaware circulation steady river flow tides at Bay mouth Circulation forms a salt wedge 10-20 km long in mid-estuary Sediment transport model (CSTM) single non-cohesive sediment parameters from Cook (2009) for Delaware ETM zonewsettle = 2 mm s-1 , Erate= 5 x 10⁻⁴ kg m-2 s-1 , τcrit= 0.2 Pa Circulation forms an Estuarine Turbidity Maximum upstream of salt wedge Nitrogen cycle model (Bio_Fennel): NO3, NH4, plankton, zooplankton, detritus, benthic remineralization, denitrification initial/river values from Sharp NO3 = 50, NH4 = 5 mmol m-3 …
Summary (2) Light absorption model: Attseawater + Attchl*[chl] + Attsed*[sed] ; Attsed = 250 from Hill (OASIS) Light penetration depth scales, maximum chlorophyll, NO3 and sediment in the 2-D model are comparable to observations Chlorophyll concentrations are low upstream of ETM, and there is little consumption of nitrogen Turbidity attenuates light to levels that suppress primary productivity despite ample nutrients Downstream from ETM, turbidity decreases, water column stratifies and phytoplankton bloom occurs Without AttSed, nitrogen is consumed in the upper estuary and the Bay ecosystem becomes unrealistically nutrient limited
Mean salinity in model down estuary from canal C&D canal ROMS 3-D Delaware model seaward landward Mean along-estuary velocity at cross-section velocity cross-section ROMS Delaware 3D model Observed