Download
1 / 21
210 likes | 232 Views
Explore the correlation between foreclosures and crime in Providence through in-depth analysis, mapping, and community partnerships. Learn about The Providence Plan's mission to enhance the city's economic and social well-being using innovative GIS and data tools.

E N D
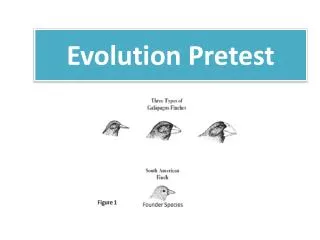
Foreclosures and Crime: Providence Examples and Evolution The Providence Plan National Institute of Justice NIJ Conference on Foreclosure and Crime March 31 – April 1, 2009 Jim Lucht The Providence Plan jlucht@provplan.org
Mission to promote the economic and social well-being of the city, its people, and its neighborhoods. • 501(c)3 non-profit created in 1992 • Public/Private Partnership Who is ProvPlan? • “Information for Change” Agenda • Information intermediary and community convener • Investments in GIS, data analysis, and web technology • Expanding our capacity to examine statewide issues • Strong programmatic capacity • Ready to Learn Providence • YouthBuild Providence • Local Learning Partnership/Making Connections • New Roots Providence
NEIGHBORHOOD CITY TRACTS BLOCK GROUPS PARCEL BLOCKS Geography Matters A Variety of Geographic Levels is Needed: • People relate to places they’re most familiar with • Differences are more readily observed at certain scales • Address and parcel-level information provide the greatest flexibility
Neighborhood Profiles • Special Portals • - Health • - Reentry • Internet Map Server Tools
Background • Slow to start foreclosure mapping • Seen as purview of City, State • Dictated by need • 2nd NIJ Geospatial Solicitation • Local CDCs
Weekly statistics and maps Live mapping at staff meetings Specialized analysis Crime Mapping / Analysis
CopperTheft Where’s the kitchen? Photo: Providence Journal
Foreclosure and Abandonment • Advertised Initiations • Student-gathered data on boarding and abandonment Photo: Providence Journal
Basic Foreclosure Mapping • Thematic • Hotspot • Animations • Parcels
Predominant Race/Ethnicity 2000 Census Blocks Source: 2000 Census SF1
Neighborhood Impact Data had only addresses. Required link to plat-lot using master lookup table
Preliminary Analysis for NIJ: October 2007 • Overall crime 2.9 times higher within 50 feet of foreclosed property • Burglary 5x City Avg. • Vandalism 3x • Drug Arrests 3.4x • Time series (q1,q2 v. q3,q4) showed 50% crime and 200% Call for Service increase <Placeholder Graphic>
LISC CSI • Parcels ID’d • Crimes pinpointed
LISC CSI • Combined hot spots
Distressed Property Management System • Open Source: Django, PostGIS • Commercial and municipal data feeds • Parcel and address-based • Asynchronous data linking • May add crime if funding allows