Download
1 / 2
20 likes | 231 Views
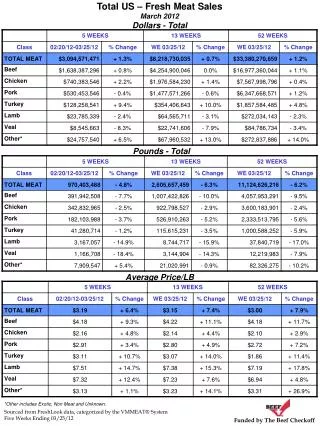
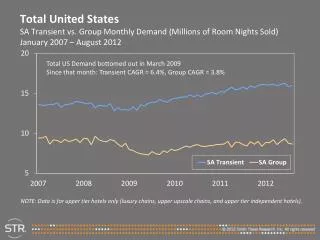
Total United States SA Transient vs. Group Monthly Demand (Millions of Room Nights Sold) January 2007 – August 2012. Total US Demand bottomed out in March 2009 Since that month: Transient CAGR = 6.4%, Group CAGR = 3.8%.

E N D
Total United StatesSA Transient vs. Group Monthly Demand (Millions of Room Nights Sold)January 2007 – August 2012 Total US Demand bottomed out in March 2009 Since that month: Transient CAGR = 6.4%, Group CAGR = 3.8% NOTE: Data is for upper tier hotels only (luxury chains, upper upscale chains, and upper tier independent hotels).
Total United StatesSA Transient vs. Group Monthly ADR ($)January 2007 – August 2012 NOTE: Data is for upper tier hotels only (luxury chains, upper upscale chains, and upper tier independent hotels).