Download
1 / 26
550 likes | 2.3k Views
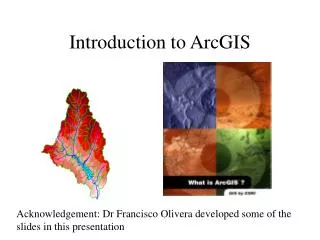
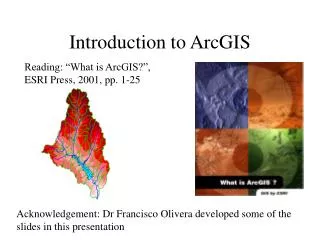
Introduction to ArcGIS. What is GIS?. Geographic Information Systems A database system in which the organizing principle is explicitly SPATIAL. What Can You Do With GIS?. With GIS, you can analyze EVERY POSSIBLE MAP! With the right data, you can examine… Land Elevation

E N D
What is GIS? Geographic Information Systems A database system in which the organizing principle is explicitly SPATIAL
What Can You Do With GIS? • With GIS, you can analyze EVERY POSSIBLE MAP! • With the right data, you can examine… • Land • Elevation • Population density • Distance to public restrooms • Noise levels • Anything you can associate with a location!
GIS Maps Contain Layers • GIS organizes the world into ‘layers’ of geographic objects that are alike.
Layers Can Contain Features • Features are geographic objects that can have shape and dimension. • Can be ‘modeled’ as points, lines, or polygons. • Mine Locations • Streets • Census Blocks • This is referred to as the Vector Data Model
Features Can Have Attributes In this example, each Census Block feature is associated with dozens of Demographic Attributes
The Raster Data Model • The Raster Data Model is used to model spatial phenomena that vary continuously over a Surface and that do not have discrete dimension • Elevation • Temperature • Rainfall • Noise Levels
The Raster Data Model • The Raster Data Model is used to model spatial phenomena that vary continuously over a Surface and that do not have discrete dimension • Things like elevation, temperature, slope and precipitation have measurable values for any particular location on the earth’s surface.
Digital Photos • The most familiar type of Raster Data is the digital photograph. • Digital Photos are raster datasets that record the relative amount of light being reflected off of a surface.
Putting It All Together – GIS Analysis Because GIS Data is organized based upon location, unlike data can be ‘overlaid’ and analyzed based upon spatial relationships: • Coincidence • Proximity • Containment • Adjacency • Intersection
GIS Analysis – For Example… Suppose we are interested in the parts of streets that are within 500 meters of rivers & streams in a city…
GIS Analysis – For Example… …using GIS Software, we can create a 500 meter ‘buffer’ around all rivers & streams in our area of interest…
GIS Analysis – For Example… …then we can overlay our streets with this new ‘buffer feature’
GIS Analysis – For Example… …and finally, we can ‘clip’ the streets to extent of the buffer feature to end up with a layer that describes all streets within 500 meters of a river or stream!
GIS Analysis – For Example… Or perhaps we would like to examine the statistical relationship between two variables. For example, elevation and temperature…
GIS Analysis – For Example… We can overlay our elevation and temperature data, based upon location…
GIS Analysis – For Example… The values from each data layer can then be extracted for corresponding locations…
GIS Analysis – For Example… …these values can then be exported to statistical software…
GIS Analysis – For Example… …in order to examine whether there is a statistical relationship between elevation and temperature…
Scanned, Cropped, Georeferenced Using Modern Geographic Placenames
Used to trace Postal Routes Corresponding to Boswell’s Itinerary…