Download
1 / 11
110 likes | 232 Views
Farm safety: Where we have come from ? and Where we are headed ?. Tony Lower Farmsafe Australia Symposium - Oct 31, 2013. Australian Farm Injury Deaths (1989-2013). Media Data Only. Age Distribution (2001-10). Farm Injury Deaths 2001-2013. Media Monitors. Media Monitors 2012

E N D
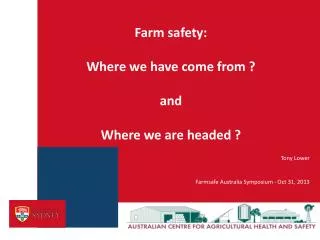
Farm safety: Where we have come from ? and Where we are headed ? Tony Lower Farmsafe Australia Symposium - Oct 31, 2013
Australian Farm Injury Deaths (1989-2013) Media Data Only
Media Monitors Media Monitors 2012 • 50 deaths (+ 87 injuries) • Quads = 10 (+ 8 off-farm) • Tractors = 9 • Utes = 5 • Grain auger = 2 • Harvester = 2 • Kids = 13 (quads 4, drowning 4) Media Monitors 2013 (YTD) • 47 deaths (+ 85 injuries) • Quads = 10 (+ 5 off-farm) • Tractors = 8 • Mobile plant = 6 • SSV = 3 • Farm vehicle NEC = 3 • Kids = 8 (mobile plant 2, farm vehicle NEC 2, quad 1, ute 1, m/cycle 1, drowning 1) Media Monitors 2011 • 59 deaths (+ 81 injuries) • Quads = 17 (+ 4 off-farm) • Tractors = 10 • Cattle = 3 • Motorcycle = 2 • Utes = 2 • Kids = 8 (quads 4, drowning 2)
A Tale of Two Industries Serious injury incidence rate
Australian WHS Strategy Targets 2022 • A reduction of at least 20% in the number of worker fatalities due to injury. • A reduction of at least 30% in the incidence rate of claims resulting in one or more weeks off work. • A reduction of at least 30% in the incidence rate of claims for musculoskeletal disorders resulting in one or more weeks off work.
Major Issues & Potential Controls (Preliminary) Of the 779 deaths in the 2001-2010 period, six leading agents were responsible for 50% (n=391) of all cases. Agent% of Total • Tractors ~ 15% • Quad bikes ~ 11% • Dams/water bodies ~ 9% • Farm utilities ~ 6% • Motorcycles ~ 6% • Horses ~ 4% Potential Controls - ROPS, Safe access - CPDs, no kids/pass, helmet - Safe Play Areas (<5yrs) - Seat belts, no riding in tray - Helmet - Helmet
Potential for Prevention 2001-10 (Preliminary) • Major Killers No. Preventable Deaths? No. (%) • Tractors* 116 • Quad Bikes** 83 • Drowning 68 • Farm Utes 47 • Motorbikes* 45 • Horses* 34 TOTAL 393 ROPS/safe access 23 (20%) CPD/helmet/no passengers/kids 62 (75%) Safe Play Area 29 (43%) Seat belt/no tray travel 24 (51%) Helmet 5 (11%) Helmet 6 (18%) TOTAL 149 (38%) • Note: Highly conservative estimates as * had almost 50% of cases where enough information was not available to provide an accurate estimate on whether a preventive option my have worked & ** had almost 20% of cases in this category.
Farm Injury - To Do List Where have we come from? • Big reductions over past 20+ years, but not to level of other industries Where we are headed ? • We can reach or exceed the 20% national target for reducing fatalities • Doing the things that we already know work will have the greatest impact in reducing deaths and injuries We can do better!