Download

1 / 62
620 likes | 638 Views
Explore the concept of "limits" in relation to population growth, consumption, and pollution. Understand the sustainable rates of resource use, emission, and regeneration. Discover the role of sinks, carrying capacity, renewable and nonrenewable resources, and the impact of energy consumption. Examine the relationship between population growth and resource limitations. Learn from Thomas Malthus' logic and the potential conflicts arising from population and consumption.

E N D
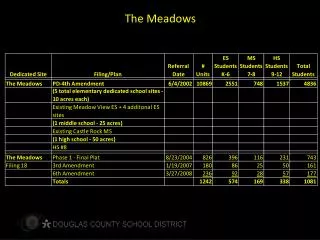
Meadows Beyond the Limits
Threats from population explosion and “limits” to finite resources? Limits (Meadows et al.) When Meadows et al. wrote of “limits,” they were referring to limits to the rates at which modern human lifestyles and associated consumption through capitalism and industrialization can use materials and energy, and limits to the rates at which wastes can be emitted without harm to people, the economy, or the earth’s processes of absorption, regeneration, and regulation.
Pollutant E.G. gases emitted from your car into the air, tailings from an industrial plant released into soil, chemicals from a paper mill released into a lake -- the sustainable rate of emission can be no greater than the rate at which that pollutant can be recycled, absorbed, or rendered harmless by the environment. (For example, sewage can be put into stream or lake at the rate at which the natural ecosystem in the water can absorb its nutrients -- the antithesis is represented by some factory farms like chickens in MD.) Sinks To illustrate, lakes, forests, oceans are examples of “sinks.” For example, forests can absorb carbon, but how well they do this depends on how much carbon and how much forest there is…there are “limits”! Sources are obvious e.g. fish. We model these using scientific methods. Carrying capacity Represents the maximum population of a particular species that a given habitat can support over a particular period of time.
Renewable resource E.G. soil, water, forest, fish -- the sustainable rate of use can be no greater thank the rate of regeneration. (Thus, for example, fish are harvested sustainably when they are caught at a rate that can be replaced by the remaining fish population.) Nonrenewable resource E.G. fossil fuel, high-grade mineral ore, fossil ground water -- the sustainable rate of use of which can be no greater than the rate at which a renewable resource, used sustainably, can be substituted for it. (E.G., an oil deposit would arguably be used sustainably if part of the profits from it were systematically invested in solar collectors or in tree planting, so that when the oil is gone, an equivalent stream of renewable energy is still available.)
solar energy Meadows high grade energy GLOBAL ECOSYSTEM PLANETARY SOURCES materials and fossil fuels (non-renewable) ECONOMIC SUBSYSTEM (population and capital) low grade energy wastes and pollution (throughput) PLANETARY SINKS heat loss
The hydrologic cycle -- more to come in the water pollution section
http://www.nationalatlas.gov/climate.html http://www.ilpi.com/msds/ref/distanceunits.html 1 inch =s 25.4 millimeters
Stable or diminishing supply and rising demand in consumption and pollution How much can the “sinks” absorb?
Who and how are we filling the “sinks?” ANALOGY: An example from the world of conservation biology Indicator species Species that serve as early warnings that a community or ecosystem is being degraded. Arguably, we can use energy consumption as an indicator that a society is consuming many resources, and therefore may be having a relatively large impact upon earth and its “non-renewable” resources when compared to other communities living a different lifestyle which is not so energy consumptive. A result is what Meadows refers to as massive “throughput.”
Where are Meadow’s “sinks” and where is resource use most intense?!
Energy production as an “indicator” of the state of the earth Where are you from? Run Elemental Geosystems CD map section day/night animation
solar energy Feedback high grade energy PLANETARY SOURCES GLOBAL ECOSYSTEM materials and fossil fuels (non-renewable) ECONOMIC SUBSYSTEM (population and capital) low grade energy wastes and pollution (throughput) PLANETARY SINKS heat loss Overflowing?! The blame game Population VS. Consumption per capita!
Meadows and Foster both hint at the potential for conflict
IRAN IRAQ Saudi Arabia
Class • Kuwaiti Claims $ • A • 307,600,000 • B • C • 2,199,800,000 • D • 5,161,600,000 • E • 39,836,300,000 • F • 69,093,600,000 • TOTAL • 116,598,900,000 Total Claims
Thomas Robert Malthus (1766-1834) Meadows says consumption and pollution are main environmental problems, What about the added impacts of growing populations? (3rd World problem?!_ WE STOP HERE “The number of mouths to be fed will have no limit; but the food that is to supply them cannot keep pace with the demand for it; we must come to a stop somewhere, even though each square yard, by extreme improvements in cultivation, could maintain its man. we shall be hurled once more into a profounder abyss of misery, want, and barbarism that ever by the sole operation of the principle of population!”
Population Change = (Births + Immigration) – (Deaths + Emigration) Mathusian logic Thomas Malthus in the early 1800s. Started arguments regarding whether there are physical and biological limits to growth, beyond which both ecological and economic collapse are likely to occur. Population change equation But consumption is not linear, as we consumer more and more per capita (draw if nec.)
Annual world population growth <1% 1-1.9% 2-2.9% 3+% Data not available These are percentages, so the resulting total numbers in pop growth vary dramatically
We speak of the limits science now knows about, learning from history, yet a few decades ago we knew nothing of many (climate chg). How many did Malthus know of? So…what is the role of “frontier science?”
Pessimists… a cause for concern? In general, we would choose a population size that maximizes very broad environmental and social options for individuals. G. Daily, A. Ehrlich & P. Ehrlich, 1994 (assumes limits and control)
I consider the dramatic growth in the world's population to be the greatest challenge currently facing the environment... The effects of this rapid increase are felt around the globe. Starvation, deforestation and lack of clean water are just some of the problems.. Al Gore, U.S. Vice-President
"Democracy cannot survive overpopulation." Isaac Asimov
"What becomes of the surplus of human life? It is either, 1st. destroyed by infanticide, as among the Chinese and Lacedemonians; or 2d. it is stifled or starved, as among other nations whose population is commensurate to its food; or 3d. it is consumed by wars and endemic diseases; or 4th. it overflows, by emigration, to places where a surplus of food is attainable.” James Madison, 1791
160 140 Hare 120 Lynx 100 Population size (thousands) 80 60 40 20 0 1845 1855 1865 1875 1885 1895 1905 1915 1925 1935 Year The Role of Predation in Controlling Population Size What eats us?! (...that we let stay around) (hazard mitigation and medicine)
Exponential growth Growth in which some quantity, such as population size or economic output increases by a fixed percentage of the whole in a given time period; when the increase in quantity over time is plotted, this type of growth yields a curve shaped like the letter J. Growth that follows a geometric pattern of increase, such as 2, 4, 8, 16, etc. Linear growth Growth in which a quantity increases by some fixed amount during each unit of time. pen
Population size (N) Time (t) Exponential Growth
BACK FROM ENV SC ANIMATION ENV SC Animation on E growth (on CD)
The origin of our most pressing environmental issues?! Will industrialization and a consumption intensive approach lead to overflowing our sinks and running out of resources on national and global scales? What will be the result of this?
BACK FROM CNN VIDEO Is reducing population and its flow always a good thing? In the U.S. (CNN pop video) Non-mechanized labor New ideas Immigrants make great contributions to life in other countries -- be they Irish, Italian, Chinese, Filipino, etc. etc. Populations age if they reach negative population growth -- social security funds!!
A brief Global South (less-wealthy countries) critique Bigotry or misunderstanding? The case of insurance
Infant deaths per 1,000 live births <10 <10-35 <36-70 <71-100 <100+ Data not available ?One reason to have large families?
BACK FROM DEM TRANS Is it population… or is it consumption per capita! Link dem trans anim Should we be graphing population, or consumption per population?!
Society Kilocalories per Person per Day Modern industrial (United States) 260,000 Modern industrial (other developed nations) 130,000 Early industrial 60,000 Advanced agricultural 20,000 Early agricultural 12,000 Hunter– gatherer 5,000 Primitive 2,000
Red is carbon dioxide greenhouse gas emission Green is represents the “sink” (Meadows)