Map Language
This guide provides an introduction to navigating maps, using a 1:50,000 scale map as a reference. Key concepts covered include checking elevation units (feet or meters), understanding latitude and longitude markings, and recognizing the differences among true north, grid north, and magnetic north. Readers will learn to identify map components such as scale lines, revision dates, and conventional signs for roads, railways, and topographical features. Perfect for beginners and those seeking to enhance their map reading skills.

Map Language
E N D
Presentation Transcript
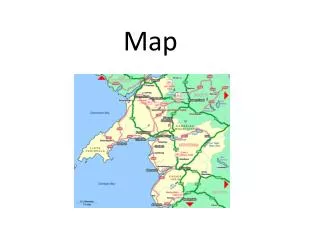
Map Language By Simon Binks
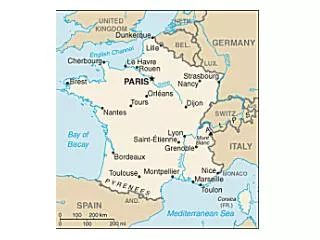
Introduction • You will have a 1:50,000 map to look at while you are working through this chapter.
Elevation • When first using a map, you must first check the units of height or elevation. • They will either be in feet or metres. • In older maps the units of elevation are normally in feet so there is a need to check. • The units of elevation are displayed on the map in the top left hand corner, key position 1 in the diagram. • It is essential when you are calculating timings that you know the correct units of height.
Latitude/longitude • The lines of latitude are expressed in degrees and minutes and are marked along the right and left (east and west) hand side of the map in key position 15. • The lines of longitude are marked along the top and bottom (north and south) of the map in key position 3. • NB: The lines of latitude and longitude are not actually drawn on the map itself.
North • In map reading there are always references to north. There are in fact 3 norths: a. True north b. Grid north c. Magnetic north a) True North • This is the geographical north pole of the earth - the point where the earth’s axis meet the surface. b) Grid North • This north takes its name from the National Grid system, a system of imaginary lines drawn vertically and horizontally which divide your map into a series of squares. • Because grid lines are drawn on a flat map and not on the curved surface of the earth as are the lines of latitude and longitude, the two systems are different • This difference is shown on the map, key position 10, as a difference between true north and grid north. c) Magnetic North • This north is the point a compass will point to, actually being the south pole. • The earth has its own magnetic field, similar to that produced by a giant bar magnet running along the earth’s axis.
Map Identification • On the M726 Series of maps the identification box is found at key position 5, at both the top and bottom of the right hand column. This gives details such as: • a. SERIES M726 (type and scaling of map) • b. SHEET 139 (particular area covered by map) • c. EDITION 6-GSGS (Geographical Section General Staff, Authority in UK) • There will be times when the information in this box will change. The most noticeable change will be the edition number. Title • In the top right hand area of the column you will find the title of the sheet at key position 4. This will be a rough guide to the area covered by the map.
Scale and Scale Lines • The scales are situated along the bottom of the sheet at key position 13 and they give you: distances in nautical miles, statute miles and kilometres. • A nautical mile = 6080 feet = 1.85 km • A statute mile = 1760 yards = 1,6093 km • A kilometre = 0.6214 mile or 5/8 of a mile • These scales can be used to obtain measurements for calculations of distances when route planning in the field.
Revision • The revision date is an important feature on a map because it gives the user an idea how up-to-date it is. • The revision date can be found under the heading ‘COMPILATION AND REVISION’ which is in the lower quarter of the right hand column at key position 11. • The date will tell when the last set of changes to effect the map were added. • Changes include such things as: new motorways, major industrial developments or new housing estates.
The Map – The Main Grid • When a map maker compiles information to put on to a map the aim is to give an accurate representation of what is on the ground. • An aerial photograph of an area the same size as your map, would not give you all the information you require and would not be very clear. • A map improves on an aerial photograph by using a set of convenient signs and symbols (a kind of shorthand depicting features on the ground).
Roads and paths • Different colours represent different roads
Contour Lines • A contour line is a reddish brown line drawn on the map joining all points of equal height above mean sea level (MSL). • Mean sea level is a fixed height approximately half way between high and low tides calculated at Newlyn in Cornwall over many years. • This MSL gives a common baseline so that anywhere in the UK can be measured to give an accurate height. • By joining all the points at the same height you can achieve a picture and shape of the land.
Railways and Waterways • Railway conventional signs are used to indicate either double or single track. • Special features include tunnels, cuttings, sidings and embankments. • Stations that are open to the public are shown in red, whereas a station that is closed is shown in white. • Bridges, viaducts and tunnels especially those connected with roads, railways and waterways are shown as solid objects when above ground and as dotted or broken lines when below ground.