Download

1 / 23
230 likes | 396 Views
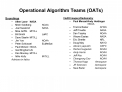
Band residual difference algorithm for operational retrieval of SO 2 from OMI. N. Krotkov 1 , K. Yang 1 , S. Carn 2 , A. Krueger 2 , P. K. Bhartia 3 Goddard Earth Sciences and Technology (GEST) Center, UMBC, Baltimore, MD Joint Center for Earth Systems Technology (NASA/UMBC), UMBC

E N D
Band residual difference algorithm for operational retrieval of SO2 from OMI • N. Krotkov1, K. Yang1, S. Carn2, A. Krueger2 , P. K. Bhartia3 • Goddard Earth Sciences and Technology (GEST) Center, UMBC, Baltimore, MD • Joint Center for Earth Systems Technology (NASA/UMBC), UMBC • Laboratory for Atmospheres, NASA Goddard Space Flight Center, Greenbelt, MD • With support from OMI Science and Support Teams
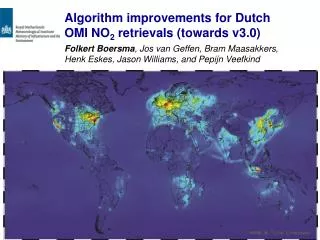
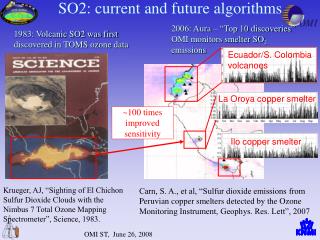
BRD (pair) SO2 algorithm An OMI SO2 Band Residual Difference ( BRD) algorithm [Krotkov et al 2006] uses calibrated residuals at SO2 absorption band centers produced by the NASA operational ozone algorithm (OMTO3) [Bhartia et al 2002]
Operational OMI SO2 products • Scheduled for public release in summer 2006 The operational OMI SO2 product contains retrieved SO2 amounts for 3 separate SO2 vertical profiles: • Explosive eruption clouds [15 km altitude, large SO2 loading, >50 DU] – NEWalgorithm • Passive volcanic degassing [5 km altitude, low SO2 loading, 0-10 DU] – NEWtemperature • Anthropogenic SO2 pollution; low altitude volcanoes [<3 km altitude (PBL), low SO2 loading] - TBD: AMF, background correction
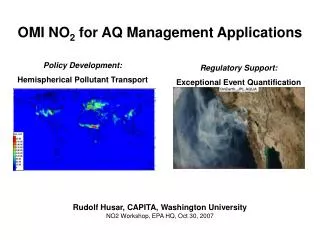
Anthropogenic SO2 • SO2 emissions have been measured by OMI over known sources of air pollution, such as Eastern China and Eastern Europe
Anthropogenic SO2 burdens in Asia • Norislk Nickel is one of Russia’s heaviest industrial polluters • World’s biggest producer of nickel and palladium • Plans to reduce SO2 emissions by 80-90% by 2015
Persian Gulf region • SO2 emissions associated with oil and gas refining in the Persian Gulf (Kuwait, Saudi Arabia, Iran, UAE) • Outgassing flares from oil fields in the Gulf produce detectable SO2
Cumulative SO2 for SW Pacific: Sep 2004 - Sep 2005 China Anatahan Manam Bagana Ambrym
Changes at Merapi (Java, Indonesia) seen by OMI Merapi Average SO2 June 1-7, 2006 Average SO2 June 8-14, 2006
New algorithm for 15km product: Sierra Negra Oct 24 2005 • Use longer wavelengths (322nm – 360nm). Find largest SO2 loading • Low temperature SCIA SO2 cross-sections. Ozone error corrections NEW OLD • Similar with BRD results for small SO2 loadings ~10 DU
New algorithm for 15km product (Montserrat May 20 2006) • Use longer wavelengths (322nm – 360nm). Find largest SO2 loading • Low temperature SCIA SO2 cross-sections. Ozone error corrections OLD NEW • Similar with BRD results for small SO2 loadings ~10 DU
BRD algorithm updates • New algorithm for Explosive eruption clouds [15 km altitude, large SO2 loading, >20 DU] • SCIA SO2 cross-sections (T dependent ) • Empirical background SO2 correction – TBD • AMF for PBL SO2 - TBD • Filter out clouds for PBL So2 data - TBD
PBL AMF PBL AMF was modeled at BRD wavelengths to convert SCD to VCD
Can we use OMI SO2 data to infer volcanic SO2 fluxes? • Kilauea (Hawaii) example • y-axis: ground-based measurements from HVO • x-axis: SO2 flux derived from OMI data using wind-speed measured at Kilauea • Red symbols: • 50 > OMI xTrack > 10 • Correlation is reasonable, though OMI estimates are an order of magnitude low
Changes at Soufriere Hills (Montserrat) seen by OMI Prior to May 20 eruption Post-May 20 eruption Increase in degassing due to removal of lava dome on May 20