
3-D Flood Risk Visualization
E N D
Presentation Transcript
3-D Flood Risk Visualization Beth Norton December 21, 2011
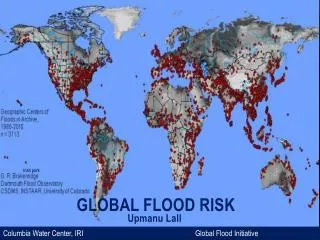
Background • Floods are one of the most common hazards in the US • FEMA provides flood risk data to community officials through flood mapping products • Participating communities in the NFIP regulate and enforce the flood maps
Problem • Risky decisions are made • Communities allowing development in the floodplain • Developers buying land and building homes in the floodplain • The impacts of these decisions aren’t borne by those making them • Homeowners purchase the risk • Federal government insures the risk • First responders risk their lives to rescue people at risk • Flood maps are 2-D and don’t portray immediate risk • The forces of flood damage can’t be shown on a 2-D map. • Homeowners and potential homebuyers need tailored information
Flooding Damage Forces • Hydrodynamic Forces • Moving water • The faster the water, the greater the pressure and erosion. • Hydrostatic Forces • Standing water • The deeper the water, the more it weighs and greater the pressure. • 3 feet of standing water can collapse a standard frame house • Debris • Ice floes • Large objects • Sediment • Soaking • Damages building materials and household goods *Source: FEMA: Managing Floodplain Development through the NFIP, 2/15/2010
Proposal (Solution) 500 year 100 year 50 year
Proposal (Solution) 500 year 100 year 50 year
Process • Software • SketchUp • 3-D Buildings • 3D Analyst • 3-D flood hazard data • ArcScene • Visualization
Data • Provided by the NCFMP • Base Data • 2010 Orthoimagery • Street Centerlines • Streams • Tax Assessor Data • LiDAR • Built-Environment Data • Digitized Building Footprints • Building Photos • Raster Datasets • Water Surface Elevation (WSEL) and Depth Rasters (Multi-Return Periods) • 10, 25, 50, 100, and 500 years
Data (cont) • Risk Data • Building Footprints attributed with • First Floor Elevations • Lowest and Highest Adjacent Grade • Number of stories • Estimated building and content loss • Flood Depths • Flood Elevations • Annualized Damages • Regulatory Data • FIRM • FIS • Database
Project Area • Tarboro, Edgecombe County, NC* • Population – 13,121 • Land Area – 9.8 square miles • Flood History • July 1919 flood • Exceeded the 100-year flood • Hurricane Floyd, 1999 • Exceeded the 500-year flood • $5 Billion in damages to NC • Hurricane Irene, 2011 * Source: 11/3/2004 FEMA Flood Insurance Study, Edgecombe County, NC
Project Area - Overview 1 4 3 2 *Source: www.ncfloodmaps.com
Project Area - Residential *Source: www.ncfloodmaps.com
Project Area – Residential and Commercial *Source: www.ncfloodmaps.com
Project Area – Lower Residential *Source: www.ncfloodmaps.com
Project Area - Undeveloped *Source: www.ncfloodmaps.com
Questions ????