Download
1 / 14
140 likes | 301 Views
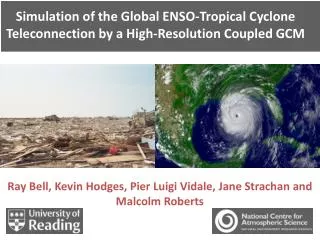
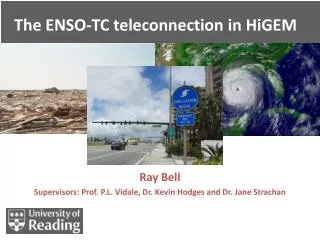
Coupled and Uncoupled Model Simulation of the Global ENSO-TC Teleconnection . Ray Bell With thanks to Kevin Hodges, Pier Luigi Vidale, Jane Strachan and Malcolm Roberts. @ RayBell_Met. Introduction. Motivation

E N D
Coupled and Uncoupled Model Simulation of the Global ENSO-TC Teleconnection Ray Bell With thanks toKevin Hodges, Pier Luigi Vidale, Jane Strachan and Malcolm Roberts @RayBell_Met
Introduction Motivation • It is important to evaluate the ability of GCMs to simulate realistic ENSO associated TC teleconnections for seasonal forecasting and before predictions are made for TCs and climate change using GCMs (Mori et al. 2013). • Lack of studies on simulated ENSO-TC teleconnection worldwide. • Research Objectives • What are the advantages and shortcomings of the simulated ENSO-TC teleconnection? • Are the key mechanisms well represented in the simulation?
Previous work Observations • The influence ENSO on TC activity has long been observed (NATL, Gray 1984; WPAC, Chan 1985; AUS, Nicholls 1975) • Reanalysis NCEP (‘50-’05) GPI. Camargo (2007)
Idealised GCM simulation HiGEM UK’s High-Resolution Global Environmental Model (Shaffreyet al, 2009) • HiGAM: AMIP (atmospheric model forced with observed SST and sea ice) 1979-2002 (Strachan et al, 2013) • HiGAM with HiGEM SST: atmosphere component forced with coupled SST HiGEM 1.1 Present-day integration 150 yrs • High-resolution climate models: • Improved representation of ENSO (Guilyardi et al. 2009) • Improved mean-state TC climatology (Strachan et al. 2013) • Improved ENSO-teleconnections (Dawson et al. 2012) N144 1.25ox0.83o, ∆x50N = 90 km 1/3o ocean model
Tracking Algorithm (TRACK) Bengstton et al (2007); Strachan et al (2013) Genesis through to Lysis A 20 year time-slice of GCM simulated tropical storms 1) Locate and track all centres of high relative vorticity 35000/yr 2) Apply a 2-day filter to the tracks 8000 storms / yr 3) Analyse vertical structure of storm for evidence of warm-core (tropical storm structure) 120 storms / yr
ENSO Composites Niño-3.4 normalised SST anomaly for DJF >1 El Niño; DJF <1 La Niña NH TCs prior to event (correlation of 0.9 with ASO SSTa) IBTrACS (1979-2010); ERA-Interim (1979-2010) 7 El Nino years (82-83, 86-87, 91-92, 94-95, 97-98, 02-03, 09-10) 6 La Nina years (84-85, 88-89, 98-99, 99-00, 07-08, 10-11) HiGEM (150 years): 31 El Ninos; 25 La Ninas HiGAM AMIP (1979-2002) :6 El Ninos;4 La Ninas Simulation of HiGEM’s ENSO is in Shaffrey et al (2009)
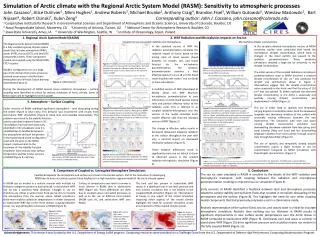
Present-day TC Climatology HiGEM: Good distribution of TCs Too many in SH (strong SPCZ) Too few in NAtL (cool SST and strong VWS) Lack of recurvate in WNP (cool SST) See Strachan et al (2013): assessment of HiGAM interannual variability and intraseasonalvariability. Bell et al (2013): evaluation of HiGEM and response to climate change
ENSO-TC Location Match well Over pronounce variability
ENSO-SST SSTs extend too far west. Lack of warming near Peru coast. (see Guilyardi et al, 2009
ENSO-Walker circulation Convection shifts Westward as SSTs extend further west Lack of upper-level westerlies
ENSO-vertical wind shear Di-pole partly explain See-saw of ActivityNATL- EPAC (aiyyer & Thorncroft, 2006) Over Pronounce in WPAC Lack of VWS dipole
Thermodynamic vs. Dynamic influences: North Atlantic Cool trop SST bias in HiGEM JASO 275-340oN, 10-20oN Average Niño-3.4 SST TC Count Too high mean-state VWS RH is well captured in HiGAM. VWS is most Important (Carmargo, 2007) VWS Vor850 RH700 -ω500
Discussion • Errors in atmospheric teleconnections stem from: mean-state SST biases; spatial pattern of ENSO associated SST. • ENSO-TC teleconnection is good west of PAC in HiGEM • Larger variability of ENSO-TC teleconnection in HiGAM without presence of air-sea feedbacks: Larger source of heat and stronger circulation Walker circulation Shifted westward El Niño SST shifted west Upper-tropospheric westerlies do not reach into NATL No change in VWS No change in TCs (HiGEM)
Conclusion • HiGEM captures the observed ENSO-TC teleconnection in the Pacific and Indian Oceans. HiGEM does not capture the response in the NATL • NATL: mean-state VWS is most important factor. Once VWS is low enough other parameters can influence (seen in HiGAM) • WNP: mean state -ω500 biases and low level vor. most important for • ENSO-TC • Bell et al (2014)Simulation of the global ENSO-Tropical cyclone teleconnection by a high resolution coupled general circulation model, JCLIM (in review) • Bell et al (2013): TCs and climate change including TC intensity projections from coupled and uncoupled simulations, JCLIM