Download
1 / 24
240 likes | 361 Views
This study explores climate variability across different time scales, ranging from millions of years to daily fluctuations, and how these variations influence human activities. It examines geological periods with warmer and colder conditions, evidential studies of past temperatures, and analyzes global temperature trends from the last 8,000 years. The research utilizes climate prediction models to anticipate temperature, cloud cover, and precipitation changes due to increased CO2 levels. Additionally, it addresses seasonal and spatial climate variations across various geographical scales.

E N D
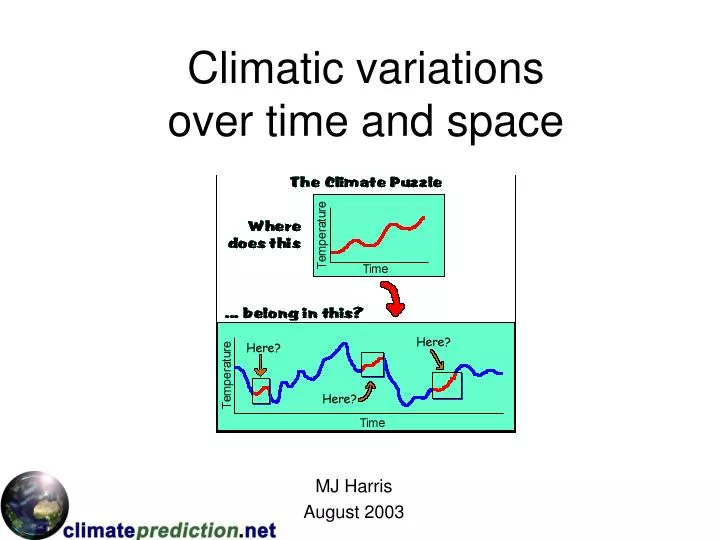
Climatic variations over time and space MJ Harris August 2003
Aims To understand that climate varies over different time scales: • Millions of years • Thousands of years • Hundreds of years • Seasonally/Annually • Daily (Diurnally)
Geological time - millions of years • Name three geological periods when conditions were warmer than today. • Name two geological periods when conditions were colder than today. • What evidence would you need to look at to investigate past temperature?
Thousand of of years • The graph shows global temperature trends over the last 8,000 years. • Identify three periods when temperatures were higher than today. • What has been the range of temperature variation over the last 8,000 years? • Give some examples of how differences in temperature have affected man’s activities.
Hundreds of years (1860-2000) • The graph shows global average surface temperatures from 1860 to 2000 • Describe the overall trend of the graph. • Comment on the variations.
climateprediction.net - graphs • Phase 1 (1810-1825 pre-industrial) This is the calibrationphase and the temperature of the ocean is artificially held constant. • Phase 2 (1825-40) This is the controlphase CO2 levels in the model are kept constant at pre-industrial levels of 282 ppm. The temperature of the ocean is allowed to vary according to how much energy the ocean receives and emits. • Phase 3 ( 2050-2065) CO2 levels are doubled and then held constant.
CO2 doubling/temperature • What does this model run suggest will happen to global temperatures (red line) if CO2 levels are doubled in 2050? • What state would probably be reached after about 10 years?
CO2 doubling/cloud cover • What does this model run suggest could happen to global cloud cover (red line) if CO2 levels were doubled in 2050? • Suggest a possible explanation?
CO2 doubling/precipitation • What does this model run suggest could happen to global precipitation (red line) if CO2 levels are doubled in 2050? • However there are likely to be large regional variations….
Seasonal/annual • The climograph shows average climatic data for London, UK • Which month is the warmest and what is the temperature? Why? • Which month is the coldest and what is the temperature? Why? • Comment on the pattern of rainfall throughout the year. • Describe and suggest explanations for the pattern of sunshine throughout the year.
Daily Timinou London • The graph shows diurnal temperature variations on a November day for Timinou, Sahara (top dashed line 0 Longitude, 30 Latitude) and London, UK (solid bottom line 0 Longitude, 52 Latitude). • Describe the diurnal temperature variations for each location. • Suggest reasons for the differences between the two locations. • Now use your own data to repeat this exercise for two other contrasting locations.
Climate also varies spatially (over space) at different scales • Global • Continental • National • Regional • Local
Climateprediction.net - maps • Climateprediction.net plots maps at various scales to show predicted temperature, cloud, precipitation and snowfall at various stages of the model. • The above map shows global variations in temperature (March, April, May) at the pre-industrial phase (1810 -1825)
Maps ……. • The following maps of temperature, precipitation, snowfall and cloud cover are plotted for the Pre-Industrial phase (1810-1825) of the climateprediction.net model. • The seasons refer to the northern hemisphere: • Winter – December, January, February • Spring – March, April, May • Summer – June, July, August • Autumn - September, October, November
Winter v Summer temperature Winter • Study the winter temperature map (left) • Describe the distribution of global temperature. • Why are temperatures so low in central Asia and northern Russia? • Why are temperatures so high in Australia? • Study the summer temperature map (right) • What has happened to the band of highest temperature (the thermal equator)? • Why is there little seasonal change in ocean temperature? Summer
Summer precipitation • Study the map of summer precipitation. • Where is the highest daily rate of precipitation? • What factors explain this high rate of precipitation during the summer season. • Describe the benefits and problems of high rates of precipitation.
Winter snowfall • Study the map of winter snowfall. • Which hemisphere has most winter snowfall? Why? • What factors might explain the high rate of snowfall in Western Canada? • Describe the benefits and problems of high rates of snowfall.
Summer % cloud cover • Study the map of summer cloud cover. • Describe and explain the areas which have a) highest b) lowest % cloud cover. • What role do clouds play in the energy budget?
Global temperatures 2050 This figure shows the Met Office’s ‘best guess’ at predicted changes in temperature by 2050 relative to the present day. Describe the patterns. Why are land areas likely to warm up faster than the oceans?
Impacts on atmosphere and hydrosphere • The diagram shows identified changes in atmospheric and hydrological characteristics resulting from global warming. • What changes have been identified in the following: • Ocean temperature • Sea-levels • Cloud type and amount • Snow cover • CO2 levels
Continental scale - Africa • The animated image shows diurnal (daily) variations in temperature across the continent of Africa. • Which regions of Africa have the highest temperatures? Why?
Climatic change at a national andregional scale • The map shows one prediction of weather changes in the UK by the year 2080. • What impact may these predicted changes have in the following areas: • South-East England? • Coastal areas? • Describe some of the positive and negative impacts of the changes. • What management plans may be needed to cope with the impacts?
Climatic variations - local scale • The diagram shows a temperature transect across a city. • Describe the temperature transect. • Why are temperatures higher in the centre of most cities? • Describe and explain how cities may influence other climatic characteristics e.g. rainfall amount and intensity, wind speed, cloudiness, frequency of fog/smog and air quality. Source LLBL Heat Island Group http://eande.lbl.gov/HeatIsland/