Enhancing Project Management with a Novel Visual Correlation Interface
This paper presents an innovative visual correlation interface designed for project managers, addressing common challenges in resource allocation, task management, and skill set alignment. By utilizing a radial structure, project resources and tasks are displayed through colored swaths, which signify project involvement and time commitment. Initial user trials demonstrated significant improvements in both speed and accuracy when navigating team relationships and project requirements compared to traditional organizational charts. This approach offers a universal solution adaptable to various domains beyond project management.

Enhancing Project Management with a Novel Visual Correlation Interface
E N D
Presentation Transcript
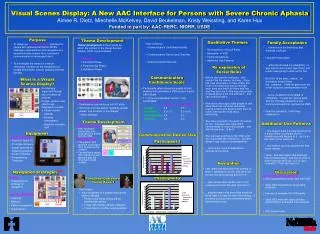
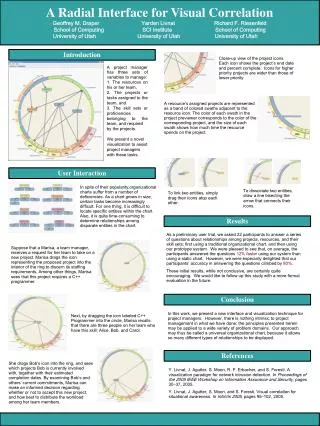
A Radial Interface for Visual Correlation Geoffrey M. Draper Yarden Livnat Richard F. Riesenfeld School of Computing SCI Institute School of Computing University of Utah University of Utah University of Utah User Interaction Introduction Results Conclusion References Close-up view of the project icons. Each icon shows the project’s end date and percent complete. Icons for higher priority projects are wider than those of lower priority. A project manager has three sets of variables to manage: 1. The resources on his or her team, 2. The projects or tasks assigned to the team, and 3. The skill sets or proficiencies belonging to the team, and required by the projects. We present a novel visualization to assist project managers with these tasks. A resource’s assigned projects are represented as a band of colored swaths adjacent to the resource icon. The color of each swath in the project previewer corresponds to the color of the corresponding project, and the size of each swath shows how much time the resource spends on the project. In spite of their popularity,organizational charts suffer from a number of deficiencies. As a chart grows in size, certain tasks become increasingly difficult. For one thing, it is difficult to locate specific entities within the chart. Also, it is quite time-consuming to determine relationships among disparate entities in the chart. To dissociate two entities, draw a line bisecting the arrow that connects their icons. To link two entities, simply drag their icons atop each other. As a preliminary user trial, we asked 22 participants to answer a series of questions about relationships among projects, resources, and their skill sets; first using a traditional organizational chart, and then using our prototype system. We were pleased to see that, on average, the participants answered the questions 12%faster using our system than using a static chart. However, we were especially delighted that our participants’ accuracy in answering the questions climbed by 80%. These initial results, while not conclusive, are certainly quite encouraging. We would like to follow up this study with a more formal evaluation in the future. Suppose that a Marisa, a team manager, receives a request for her team to take on a new project. Marisa drags the icon representing the proposed project into the interior of the ring to discern its staffing requirements. Among other things, Marisa sees that this project requires a C++ programmer. In this work, we present a new interface and visualization technique for project managers. However, there is nothing intrinsic to project management in what we have done; the principles presented herein may be applied to a wide variety of problem domains. Our approach may thus be called a universal organizational chart, because it allows so many different types of relationships to be displayed. Next, by dragging the icon labeled C++ Programmer into the circle, Marisa recalls that there are three people on her team who have this skill: Alice, Bob, and Carol. She drags Bob’s icon into the ring, and sees which projects Bob is currently involved with, together with their estimated completion dates. By examining Bob’s and others’ current commitments, Marisa can make an informed decision regarding whether or not to accept this new project, and how best to distribute the workload among her team members. Y. Livnat, J. Agutter, S. Moon, R. F. Erbacher, and S. Foresti. A visualization paradigm for network intrusion detection. In Proceedings of the 2005 IEEE Workshop on Information Assurance and Security, pages 30–37, 2005. Y. Livnat, J. Agutter, S. Moon, and S. Foresti. Visual correlation for situational awareness. In InfoVis 2005, pages 95–102, 2005.