Download
1 / 64
640 likes | 786 Views
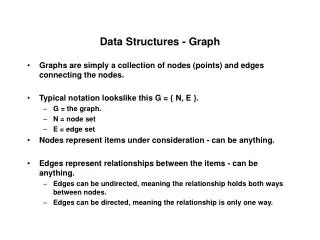
a graph that uses symbols to show data. Pictograph. the number that is the result of multiplying 2 or more factors together. Product. the part of a graph which tells what each symbol stands for. Key. a picture that stands for something else. Symbol. a graph that uses bars to show data.

E N D
the number that is the result of multiplying 2 or more factors together
the number that is the result of adding 2 or more addends together
to arrange numbers from least to greatest or greatest to least
the number that is the result of subtracting one number from another.
a group of related facts. Example 4+3=7, 3+4=7, 7-4=3 and 7-3=4
a way to write a number that shows the place value of each digit. Example 9,000+500+30+2