Download
1 / 39
770 likes | 1.91k Views
Introduction to Economic Value Added. September 2003, Esa Mäkeläinen, Valuatum Oy Contents 1. Basis of EVA: alternative return of capital 2. Definition of capital costs and EVA (practical level, not detail) 3. Characters, comparison to ROI, EBIT etc. 4. EVA and market values

E N D
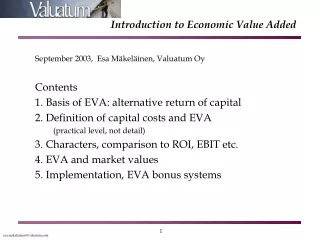
Introduction to Economic Value Added September 2003, Esa Mäkeläinen, Valuatum Oy Contents 1. Basis of EVA: alternative return of capital 2. Definition of capital costs and EVA (practical level, not detail) 3. Characters, comparison to ROI, EBIT etc. 4. EVA and market values 5. Implementation, EVA bonus systems
History and background • Old concept (Residual Income = Operating profit - capital costs) (1800-century) • However: the development level of capital markets, estimation of cc, Shareholder Value -approach. were not supporting it those days • In the late 1980´s Stern Stewart & Co (U.S.) • name and trademark EVATM (Economic Value Added) • presented the superior characters in perform. measurement, link to market values (the bigger EVA, the bigger m-cap), bonus systems • presented some very successful EVA management and bonus systems (e.g. (Coca-Cola, WalMart, Briggs & Stratton, AT&T) • During 90´s to almost every big US-company (most used measure) What EVA has had to give in order to expand like this? • First financial performance measure for which maximizing is a sensible objective • Superior performance measure compared to e.g. operating profit, profit after fin. items, EPS, ROI, ROE… (explained later in detail why) • Still very simple and practical also in operational level • Improves profitability normally first through improved capital turnover • Very suitable for bonus systems (logically after the first point)
The basis of EVA: The average return on stock market • The return of the most important stock indices during the last 20 years
The basis of EVA: The average return on stock market • The return on stock markets has always (whole 20th century) been stable in the long term (about 6%-points above the long-term risk-free rate) • Nominal yields are not reliable comparison basis without considering inflation, therefore it is easier to talk about return in excess of the risk free rate) • Investors can easily achieve the average index return with long-term investments (diversified portfolio) • Therefore owners do not in the long-term have to accept returns below this average ==> the average long term equity return is also the alternative return for equity investments. Keeping money in companies producing less in the long-term is not sensible
Return to owners • Let us assume that the companies at the market achieve a return of 10% on average. The following figure represents how the owners treat their holdings in different companies Average return 10% Companies B and C: Insufficient yield: Capital will be withdrawn gradually: (investments to minimum) Company D: Sufficient return: Operations continue as before Companies F and G: Above average yield: more investments, operations will be expanded Company A: Negative return: discontinued
Average cost of capital • The cost of capital of a company is the average cost of equity and debt • The cost of debt should be defined as the (long term) risk free rate + company premium, e.g. 3,5% + 0,3% = 3,8% • Cost of equity -> average return on similar risky investment • Cost of Equity: (long term) risk free rate + beta x (equity risk premium) => • 3,5% + 0,9 x 5% = 8,0% • Cost of capital (with target solvency) : (45% * 8,0%) + ( 55% * 3,8%)1 6% 1Tax-schield of debt not included here Cost 8,0% WACC 6,0% Cost 3,8%
Cost of capital (summary) • Every company has certain average cost of capital which depends only on operative risk and long term interest rate levels (6% in the example) • In operations only thing that matters is the average cost of capital (6%), the individual costs of debt / equity and the actual solvency can be ignored at this level • Cost of capital means the minimum return requirement, which must be achieved in order to get the owners to keep their money in these operations • The cost of all assets is the same (6%) • Cost of capital should not be mixed up with the return objectives of the company • If company produces good return on capital and big EVA, the profit objectives/targets should be given as big EVA targets and not by increasing the cost of capital
EVA vs. traditional performance measures • Measures from income statement; operating profit, profit before extras, net income, earnings per share • The investors are interested mainly on how much resources are employed by generating the profits (what is the return on their capital) • Absolute terms (euros, dollars) make these measures good from operative perspective • ROI, RONA, ROCE, ROIC... • Fixed the main deficiency of income statement measures; capital was brought into the picture • Are still not measures that could be maximised (steering failure) • Unillustrative and non-practical in operative level
EVA vs return on investment (steering failure) • Example: ROI 30%. How ROI and EVA change after an investment producing a return of 20% ? ROI does not take into account the increase or decrease in invested capital. Therefore it does not necessarily describe whether the profitability has decreased or improved => non-optimal controlling tool and bonus base
EVA vs return on investment, example 2 • Example: ROI 2%. How ROI and EVA change after an investment producing a return of 6% ?
EVA vs ROI, ROCE, RONA in operative level • Return on capital is very unillustrative measure in operative level • The costs/cost-savings of some process, function or line (production line, sales department etc.) is very difficult to convert into change in ROI. Even if this would be done the result is very uninformative • With the EVA concept all costs, cost-savings, increased revenues and costs of employed capital are comparable and are in terms of final profitability (in absolute terms like EVA itself) • Usually the importance of capital efficiency has been left aside as it has not been understood on operative level in ROI-steered companies • Therefore usually implementing EVA improves first capital turnover (decreases working capital) as the cost of employed capital comes out clearly - after these costs are taken in the monthly reporting (income statement)
Summary: EVA as a measure of profitability • First financial performance measure for which maximizing is a sensible objective • Capital and the growth of capital employed is integrated (compared to Operating profit and ROI) • Simplifies the whole concept of profitability • With traditional measures this concept has been ambiguous and complicated • Integrates the effects of profitability and growth into same measure • The main objective of any company is to increase the value of the company. EVA measures value creation and by maximising long-term EVA the company is maximising its own value • Very suitable as a bonus base • logically after the first point above • Unifies the goals of the owners and the company • Compensation tied to increasing the value of the company
EVA and market value • Financial theory suggests that the value of the company depends directly on the future EVA: • The value of the company = Book value of equity + the value of future EVA • Mathematically equal to Discounted Cash Flow -formula • Investors and analysts use EVA heavily (e.g. CS First Boston, Goldman Sachs, Morgan Stanley, Merita Securities Ltd., Mandatum Stockbrokers, Opstock) • Compare to the valuation of a bond (next slide)
Value of a bond • The bond is valued with a premium or a discount depending on the relationship between current interest rate on markets and coupon rate Interest rate (market) 4% Coupon rate 5% Interest rate (market) 5% Coupon rate 5% Interest rate (market) 10% Coupon rate 5% Coupon rate > market rate Coupon rate = market rate Coupon rate < market rate Bond market value 105 Market value premium Discount Bond nominal value 100 Bond market value 100 Bond market value 80
Coupon 5 Coupon 5 Coupon 5 Coupon 5 Coupon 5 /0,78 5. year /0,95 1. year 2. year /0,91 3. year /0,86 /0,82 4.. year Bond face value 100 returned (after 5 yr. maturity) = 82,27 = 4,76 = 4,53 = 4,31 = 4,11 Bond value: 100 Valuation of a bond 1/3 • ”The price paid for any asset should reflect the cash flows that asset is expected to generate”. E.g. ordinary government bond, with 5 years maturity and 5% coupon rate is valued in a following manner as the market interest rate is 5%: Discount factor for cash flow occurring next year: 1/(1,05) = 0,95 Discounting: change future values to present values Interest rate 5% Coupon rate 5% Bond coupon rate = market interest rate Bond nominal value 100 Bond market value 100
Coupon 5 Coupon 5 Coupon 5 Coupon 5 Coupon 5 5. year /0,62 1. year /0,91 2. year /0,83 /0,75 3. year 4.. year /0,68 Bond face value 100 returned (after 5 yr. maturity) Bond value: 81 Valuation of a bond 2/3 • Example how the bond value changes as interest rate rises from 5% (last page) to 10% (this page). Discount factor for cash flow occurring next year: 1/(1,10) = 0,91 Discounting: change future values to present values Interest rate 10% Coupon rate 5% Bond coupon rate < market interest rate Bond nominal value 100 Bond market value 81
/0,62 5. year /0,91 1. year 2. year /0,83 /0,75 3. year /0,68 4.. year Valuation of a bond 3/3 (EVA approach) Interest rate 10% Coupon rate 5% -5 -5 -5 -5 -5 Bond nominal value 100 Market Value Lost 19 Bond market value 81 The same bond market value can be calculated by focusing on the difference between annual coupon (5) and capital cost per year (10% x 100 = 10). As we discount these differences: (5 – 10 = -5 each year) to present, we see how much the market value will be below (or above) capital invested i.e. bond nominal value.
Analogy between bond and company valuation • In principle the valuation of a bond and a valuation of a company is the same: • You discount the future cash-flows into present, sum them up and thus get the bond/company value • OR: you calculate how much the company/bond earns above or below its opportunity cost (cost of capital) , discount these values to present and add this to or subtract this from the book value • We see the latter method more illustrative and practical with company valuation and thus the following pages will demonstrate how to use this method in theory and in practice. • We call the difference between company’s return and its capital costs with the name “EVA” (Economic Value Added) which is often called also Residual Income or Economic Profit as the term EVA is registered trademark of Stern Stewart & Co.
EVA valuation of a company The value of the company = Book value of equity + the value of future EVA Market value of profitable company Market value Added EVA2002 + EVA2003 + EVA2004 + … (future EVA-values are discounted to present) Capital Invested in the company (we can use Book value of Equity if we assume that book value and market value of debt is the same) Capital Invested in the company (or book value of equity) Market Value Lost (-EVA2002) + (- EVA2003)+… Market value of unprofitable company
EVA3 EVA4 + + ... (1+ re)3 (1+ re)4 (- EVA1) EVA2 + + ... (1+ re)1 (1+ re)2 Jump to updated Finnish EVA-MVA values EVA and market value, Nokia (29.11.2002) 2002E 2003E 2004E 2005E 2006E 2007E • Market • value • of • Nokia Oyj • 95 • Billion • EUR • 19,9 EUR • /share Market Value Added 80 Billion EUR 16,8 EUR /share Bn EUR /1.24 /1.38 /1.54 /1.72 /1.92 /1.115 ... Real life: Current market value of Nokia and investors’ current EVA expectations for 2002E-2007E. (in this example the estimates from 2004E- onwards are generated from current market value: what these estimates should be so that the current market value would be justified…) /1.72 /1.92 Book value of Equity 15 Billion EUR 3,1 EUR/share
Jump to updated Finnish EVA-MVA values EVA and market value, Metso (20.11.2002) 2002E 2003E 2004E 2005E 2006E 2007E +24 Me +24 Me +24 Me +24 Me -145 Me -55 Me Book value of Equity Metso Oyj 1434 million EUR 10,58 EUR/ share Market Value Lost 96 Me 0,76 e/share Market value of Metso 1338 Billion EUR 9,82 EUR/ share Real life: /1.54 /1.72 /1.92 Current market value of Metso and investors’ current EVA expectations for 2002E-2007E. (in this example the estimates from 2004E- onwards are generated from current market value: what these estimates should be so that the current market value would be justified…)
(- EVA1) (- EVA2) + + ... (1+ WACC)1 (1+ WACC)2 EVA and market value of a company Book value of Equity Market Value Lost Market value of unprofitable company When they say, that you can lose money by losing the alternative return they mean this... Finnish companies in this situation currently e.g.: Rautaruukki, Metsä-Serla, many small IT-companies…
EVA vs MVA Source: Stewart 1991
Change in EVA vs change in MVA Source: Stewart 1991
EVA vs market value with Finnish companies 1/2 Right scale: EVA - Blue bars (million euros) Left scale: Market value: Dark bars - book value, Yellow bars - MVA (up if positive, down if negative) Source: Merita Securities 1999 (current Aros-Maizals Equities Ltd. , part of Merita-Nordbanken-Unidanmark –Group)
EVA vs market value with Finnish companies 2/2 Right scale: EVA - Blue bars (million euros) Left scale: Market value: Dark bars - book value, Yellow bars - MVA (up if positive, down if negative) Source: Merita Securities 1999 (current Aros-Maizals Equities Ltd. , part of Merita-Nordbanken-Unidanmark –Group)
Implementation of EVA • The benefits of EVA materialise as the key persons of the company: • Understand what real profitability is all about • Get motivated to improve profitability • This provides that: • Key persons must understand what EVA is: where cost of capital comes from, why EVA is an important measure and better that traditional measures • EVA is shown also in operative level reports • The compensation is tied to EVA or to its drivers • If the implementation of EVA is failed the reasons have normally been the lack of EVA training among key persons or the lack of commitment from the whole upper management team
Individual steps in implementation • Top management commits to EVA and communicates it downwards • Training of key persons • EVA part of operative reporting • Bonus schemes to support improving EVA
EVA and Balanced scorecard Increased revenues Smaller capital invested Smaller costs • -Smaller inventories • -Less work in production • -Smaller sales receivables (better turnover) • -Bigger accounts payable (slower turnover) • -Better capacity utilization factor • Process passing times, inventory turnover ratios, • Better customer • satisfaction • -Delivery accuracy • -Flexibility • -Quality • -Brand • .... • -Smaller fixed costs • -Smaller variable costs • -Smaller spillage • cost per unit in the process • spillage … Other Balanced Scorecard measures
How EVA can be improved • By improving operating profit (increasing revenues, decreasing costs) EVA = Operating profit - WACC x Capital invested • By decreasing capital invested in current businesses (without affecting current operating profit) EVA = Operating profit- WACC x Capital invested(less working capital) • By investing more money in profitable projects EVA = Operating profit - WACC x Capital invested(Investment) • By withdrawing from unprofitable businesses EVA = Operating profit - WACC x Capital invested(Divestment)
EVA and compensation systems • Adequate level • As a kind of ”excess return” EVA is very suitable for bonus base, it does not give bonuses if the shareholders can not get adequate returns in relation to risk involved • Very different compared e.g. to Operating profit and Earnings • Steering: • Increase in EVA (in long -term) means also increase in profitability and company value (in contrary to traditional performance measures) • Objective level • Features above enable also big bonuses if the shareholders first benefit clearly • The management is often able to achieve big increases in shareowners’ wealth • Bonuses should not be limited as we do not want the EVA to be limited • Compensation systems the most essential area of EVA • Academic research (e.g. Wallace 1997) gives empirical support
EVA bonus schemes in different situations Source: Merita Securities 1999
EVA compensation systems and options • EVA-based compensation systems are very similar to stock options. In Both systems: • Compensation is tied to increasing the value of business • The bonus base in objective; not linked to subjective budgets • Should not include a bonus limitation in order to work optimal • For the shareholders value-based compensation systems are much less risky than any other bonus schemes – even though they are unlimited and might sometimes give very rewarding bonuses • EVA vs Stock options Pluses ++ Minuses - - • EVA can be applied also on SBU level • More clear how to affect EVA bonus • More difficult to create too generous EVA bonus scheme than stock option plan… • Options reward automatically on long term, EVA bonuses on year-to-year basis (unless a bonus bank is used)