Download
1 / 1
10 likes | 119 Views
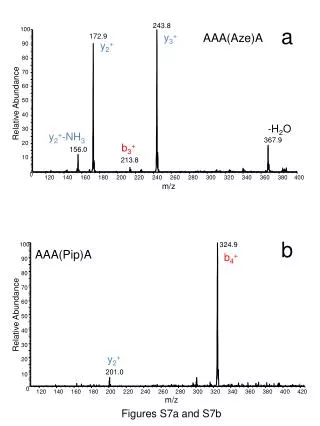
This study presents mass spectrometry data focusing on the relative abundance of various ionized species, specifically analyzing the spectra of Aze and Pip derivatives. The key findings are illustrated in Figures S7a and S7b, which depict the ion abundance (y2+, y3+, and b ions) in relation to their m/z values. Results highlight distinct patterns in ionization, shedding light on the molecular characteristics and stability of these compounds. The insights gained may contribute to further understanding of their chemical behavior in various applications.

E N D
243.8 100 172.9 90 80 70 60 Relative Abundance 50 40 30 367.9 20 156.0 10 213.8 0 120 140 160 180 200 220 240 260 280 300 320 340 360 380 400 m/z 324.9 100 90 80 70 60 Relative Abundance 50 40 30 20 201.0 10 0 120 140 160 180 200 220 240 260 280 300 320 340 360 380 400 420 m/z a AAA(Aze)A y3+ y2+ -H2O y2+-NH3 b3+ b4+ b AAA(Pip)A y2+ Figures S7a and S7b