Download
1 / 6
60 likes | 193 Views
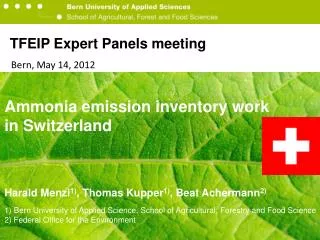
TFEIP Expert Panels meeting. Bern, May 14, 2012. Ammonia emission inventory work in Switzerland Harald Menzi 1) , Thomas Kupper 1) , Beat Achermann 2) Bern University of Applied Science, School of Agricultural , Forestry and Food Science 2) Federal Office for the Environment.

E N D
TFEIP Expert Panels meeting Bern, May 14, 2012 Ammoniaemissioninventoryworkin Switzerland Harald Menzi1), Thomas Kupper1), Beat Achermann2) Bern University of Applied Science, School ofAgricultural, Forestryand Food Science 2) Federal Office forthe Environment
Nicht Landwirtschaft Pflanzenbau ÜbrigeNutztiere Geflügel Rindvieh Schweine 95% der Ammoniakemissionenaus der Landwirtschaft Ammonia Emissions in Switzerland 2007 Total: 52.3 kt NH3-N Non agricultural emissions Crop and fodder production Agricultural emissions Other livestock Poultry 95% Cattle 49.0 kt N 46 kg/ha agric. surface Pigs 95% der Ammoniakemissionenaus der Landwirtschaft
Nicht Landwirtschaft Pflanzenbau ÜbrigeNutztiere Geflügel Rindvieh Schweine 95% der Ammoniakemissionenaus der Landwirtschaft Emissions from livestock and manureEmission sources Total: 43.9 kt NH3-N Housing34% Application47% Storage 16% 95% der Ammoniakemissionenaus der Landwirtschaft
Spatial distribution of NH3 emissions 2007 Quelle: BAFU/EMIS (2009)
Spatial distribution of N deposition Modeled N deposition Concentrationmonitoringsites Goodagreementbetweenemissioninventoryand concentrationmonitoringresults(development in time and individual sites)
Nicht Landwirtschaft Pflanzenbau ÜbrigeNutztiere Geflügel Rindvieh Schweine 95% der Ammoniakemissionenaus der Landwirtschaft Emissions from livestock and manureDevelopment 1990 - 2007 Detailedinventory -11% kt NH3-N -34% -29% -56% +50% +44% +96% 95% der Ammoniakemissionenaus der Landwirtschaft