Download
1 / 47
470 likes | 564 Views
Southeast Michigan: A Region in Transition Implications for Infrastructure. Purposes. Share most recent information on the Region Provide Context & Framework for Task Force Deliberations Respond to Task Force Questions. Percent Change in Wage & Salary Employment Michigan, 1973-2009.

E N D
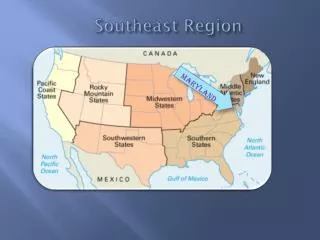
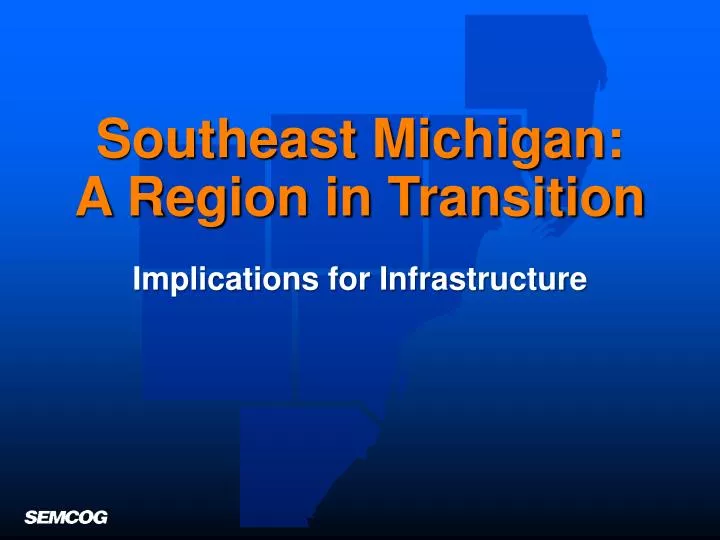
Southeast Michigan: A Region in Transition Implications for Infrastructure
Purposes • Share most recent information on the Region • Provide Context & Framework for Task Force Deliberations • Respond to Task Force Questions
Percent Change in Wage & Salary EmploymentMichigan, 1973-2009 Source: BLS
Wage and Salary Employment ChangeSE Michigan*, 2000-2009 * Lapeer, Livingston, Macomb, Oakland, St. Clair, Washtenaw, and Wayne. Source: LMI
Vehicle & Parts Manufacturing JobsSoutheast Michigan, 2001-2009 -133,600 (-65%) Source: LMI, SEMCOG
Manufacturing vs. Health Care JobsSoutheast Michigan, 2000-2009 Source: LMI
Growing and Declining IndustriesMichigan, 2002-2007 Declining Growing Sources: BLS, Don Grimes
Michigan Per Capita IncomeDeviation from National Average, 1969-2007 Source: RSQE
Total Employment*Southeast Michigan, 2000-2035 2009 Source: SEMCOG * Total Employment includes wage/salary jobs and self-employed.
Total Employment*Southeast Michigan, 2000-2035 2009 Pittsburgh Recovery Rate Source: SEMCOG * Total Employment includes wage/salary jobs and self-employed.
Population ForecastSoutheast Michigan, 2001-2035 2009 Source: SEMCOG
Percent Population 65+ 2000 2035 10% or less More than 10% to 15% More than 15% to 20% More than 20% to 25% More than 25%
Home Price, SEV, and Taxable Value Annual Percent Change in SE Michigan (Preliminary)
Percent Change in Taxable Value2008-2009, Real Property Large Loss, -5% to -16.5% Moderate Loss, -2% to -4.9% Small Loss, down to -1.9% Gain, up to 6.1%
State Revenue Sharing Paymentsto Cities, Villages, and Townships -7% to -20%
Summary • A smaller region for a long time • Declining demand • Loss of buying power and revenue base • Redefine success • not focusing on growth but right sizing • wise investment in infrastructure • building desirable communities • improving quality of life
2000 DWSD Master Plan ProjectionCompared with SEMCOG Population Data(in millions) Source: Summary Report, Comprehensive Water Master Plan, SEMCOG
Year-to-Year Percent ChangePopulation, Employment, DWSD Water Sold2005 – 2008, SE Michigan * ToDWSD Customers
Demand Drivers • Population • Profile of jobs: service----manufacturing • Buying Power/Income • Rates • Security • Others
How does changing demand affect revenue requirements? Rule of thumb: Because of high fixed cost • If water use declines 5% • Revenue needs increase 4% Source: The Foster Group
Big Picture Questions • Demand declines • Rates are increased to compensate for revenue shortfalls • Rate increases result in further erosion of demand • Need to increase rates again • How do we break the cycle?
Big Picture Questions • Large infusions of capital needed to maintain aging infrastructure • Some of that infrastructure is underutilized, and • Needs far exceed funds available • How do we decide what to fund?
Big Picture Questions • Suppose other providers of infrastructure face similar dilemmas • How do we assure solutions of various service providers fit together?
Rouge River Combined Sewer Overflow TunnelCase Example 2 Project to reduce sewer overflows/protect water 200 million gallon storage tunnel Capital cost about $880 million Expected performance: reduce overflows to 1 per year
Rouge River Policy Issues Fiscal impact on rate payers % of household income dedicated to water service Long-term debt service coverage Project deferred & contract canceled Alternative designs being explored
Big Picture Questions • How much could be saved if we changed the expected performance? • Would the different environmental impact be significant? • Who decides? • What is (should be) the basis of the decision?
Big Picture Questions • How will this decision affect funding available for other infrastructure needs? • Should that matter? • Can we be more efficient and cost effective without more collaboration? • Can we be more efficient and cost effective w/o putting expectations of service on the table?
Cost of Insufficient InvestmentSE Michigan, 2004-2008 = $1.35 billion $2.35 billion $996 million Source: SEMCOG PASER Data, January 2009
Big Picture Issues • Transportation needs far exceed existing revenue • Gas Tax funds highway and transit improvements • We are using fewer gallons of gas • Public policy is to use even fewer gallons of gas in the future
Questions • How do we fund transportation in the future? • If we don’t get significant funding increase, do we • Prioritize among many needed projects • Lower standards • Combination • How do we fund transit increases
Charting Actions Towards Sustainable Infrastructure Adaptation Change
Common Denominators Declining demand Changing standards High fixed costs Rigid standards Aging infrastructure Expectations Disjointed solutions Faulty revenue design Loss of revenue base
Next Meeting Proposed Agenda • Task Force Member Presentations • Structure of Financing • Water, sewer, roads, etc. • Identification and Discussion of Policy Issues • Fiscal and Physical • Next meeting date • Friday, November 13th 9:00 am – noon