Download
1 / 75
770 likes | 806 Views
Explore the complexities of climate change mitigation, from greenhouse gas reduction to international agreements and societal impacts, with a focus on human intervention and global cooperation.

E N D
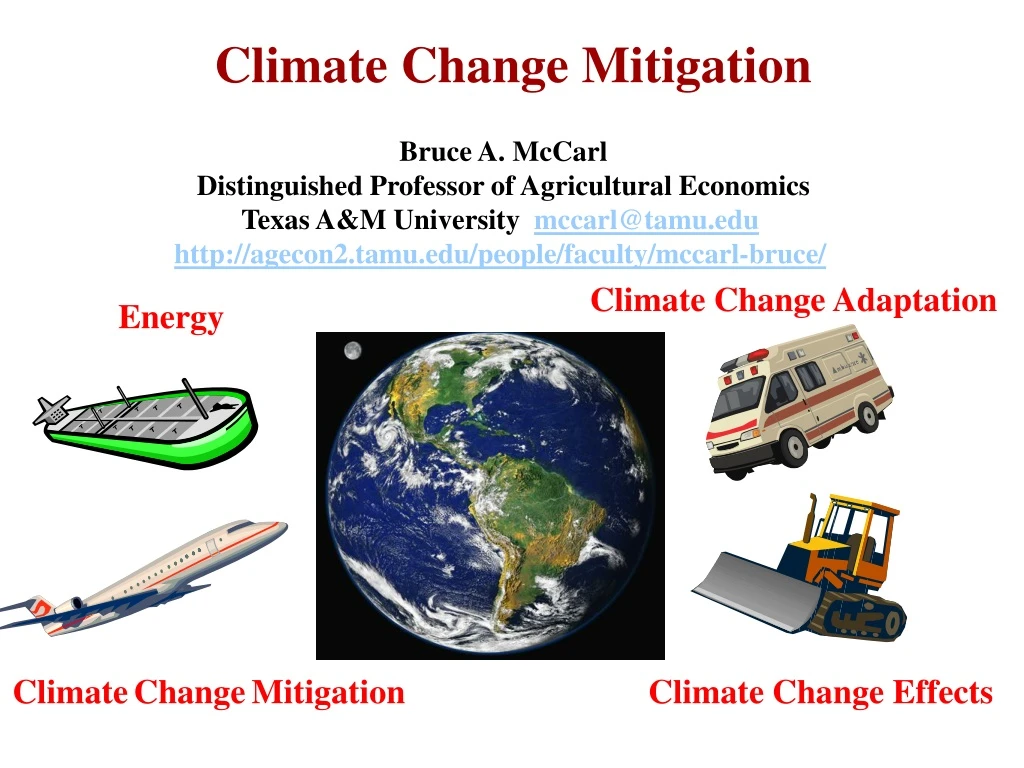
Climate Change Mitigation Bruce A. McCarl Distinguished Professor of Agricultural Economics Texas A&M University mccarl@tamu.edu http://agecon2.tamu.edu/people/faculty/mccarl-bruce/ ClimateChangeAdaptation Energy ClimateChangeMitigation Climate Change Effects
Mitigation from IPCC WGIII Glossary Mitigation is human intervention to reduce the sources or enhance the sinks of greenhouse gases. I think the definition is too narrow as geoengineering and other forms of reducing drivers are also relevant Mitigation (McCarl) A human intervention to reduce the extent of climate change by limiting drivers (anthropogenic GHGs, reducing incoming radiation, increasing reflectivity ….). Anthropogenic - of, relating to, or resulting from the influence of human beings on nature
Why Might We Mitigate? • Greenhouse gas forcing is causing climate change • Lagged time between action and response • Compliance with International agreements under UNFCCC – Paris Agreement • Domestic policy moves • International pressures for emission reduction • Industry planning under uncertainty • Need for cheap emission offsets • Congruence of programs with other agriculturally related societal desires such as farm income support and water quality protection. Plus development of another market for farm products
Why is mitigation challenging • High interrelationship between income growth and fossil fuel use -- in turn emissions • Large areas of the world are rapidly expanding economically and with that comes emissions • Power plants, cars, industrial equipment etc. are expensive long lived and will only be replaced slowly over time • We must drop to zero net emissions to stabilize • While geoengineering could reduce trapped radiation it does not help other effects like ocean acidification • Large inventory of cheap fossil fuels • Mitigation requires changes in ways we do things that can be expensive
GHG concentrations and the climate
Key Concepts • Climate Change is a global commons problem that implies the need for international cooperation in tandem with regional policies. • Because the emissions of any agent affect every other, an effective outcome will not be achieved if individual agents advance their interests independently of others. • International cooperation can contribute • Research and development in support of many forms of mitigation is a public good, which means that international cooperation can play a constructive role in the coordinated development and diffusion of technologies. • Idividual investments are likely too low • This gives rise to separate needs for cooperation on R&D, opening up of markets, and the creation of incentives to encourage private firms to develop and deploy new technologies and households to adopt them.
Effects of Mitigation Lag until effectiveness 4° What we have seen so far 2° Inevitable amount Era 1 Era 2 Source : IPCC AR5
Theworld is beginning to take action on mitigation and adaptation Energy will be affected
History -International Agreements on Mitigation UNFCCC : United NationsFramework Convention on Climate Change • Adopted on May 9, 1992 and ratified by 176 governments worldwide as of October 1998 • Developed plans for responding to climate change “... to achieve ... stabilization of greenhouse gas concentrations in the atmosphere at a level that would prevent dangerous anthropogenic interference with the climate system” (p.9). • Established to negotiate net GHGE reduction • Under it’s auspices, the KYOTO Protocol was adopted in 1997.
The KYOTO Protocol • The first major international agreement towards GHGE reduction • Industrialized countries agreed to reduce emissions of CO2, CH4, N2O, HFCs, CFs, SF6]to 5-8% below 1990 levels between 2008 - 2012. • Annex I and Annex II – developing generally excluded (ended up covering 14% of emissions) • GHGs are compared to each other using global warming potential (GWP) coefficients • Treatment of emissions of GHGs from land-use change • Approval of offsets through enhancement of sinks • Authorization of mechanisms to reduce cost of meeting target
The KYOTO Protocol – Mechanisms Mechanisms to reduce the cost of meeting the above target • International Emissions Trading (Article 17) Allows the trading of assigned amounts within or among industrialized countries to meet quantified emission limitation or reduction commitments. • Clean Development Mechanism (CDM) (Article 12) Allows industrialized countries to finance emission reductions in developing countries to help in sustainable development and receive emission credits for doing so. • Joint Implementation (JI) (Article 6) Allows Annex I transferring/acquiring emission reductions resulting from activities aiming to reduce anthropogenic emissions by sources or enhance anthropogenic removals by sinks.
Recent Policy toward Climate Change Paris Climate Agreement ( Dec 2015) 195 countries were participants 186 turned in INDCs • 1.5 to 2 degree C goal for climate change control • Submitted targets “Intended Nationally Determined Contributions (INDCs)” covering 96% of globe emissions as opposed to 14% under Kyoto • Use of transparent standardized accounting, monitoring, verify • Adaptation/mitigation fund of $100 billion per year from 2020 until 2025, after which this will increase • Agreed to haveincreasingly ambitious targetsevery five years • Set up so can be agreed to without vote of US Congress Has Shortcomings: • No coordinated mechanism but allows international transfers • No enforcement • As is reduces temperature increase to 3.5 degrees from preindustial “If all INDCs included in the pact are fully implemented, with no further action, global temperatures are expected to rise 3.5°C (6.3°F) above preindustrial levels.“(climate initiative - https://www.climateinteractive.org/tools/scoreboard/ ) • http://blogs.ei.columbia.edu/2015/12/15/a-guide-to-understanding-the-paris-climate-accord-and-its-implications/ • http://www.robertstavinsblog.org/2015/12/12/paris-agreement-a-good-foundation-for-meaningful-progress/ • Fawcett et al Science, Dec 2015
Recent Policy toward Climate Change US INDC to Paris Climate Agreement • Reduce GHG emissions 26-28% below 2005 level by 2025. • Current trajectory is 17% below 2005 levels by 2020. • Does not intend to use international market mechanisms. • Includes: Clean Power Plan, appliance efficiency, CAFÉ, California state laws, Northeast Regional GHG Initiative https://www.whitehouse.gov/the-press-office/2015/03/31/fact-sheet-us-reports-its-2025-emissions-target-unfccc http://www4.unfccc.int/submissions/indc/Submission%20Pages/submissions.aspx
US Domestic Mitigation Bush Rose Garden target in early 2000s an 18 percent reduction in emissions intensity between now and 2012 - will allow actualemissions to increase 12 percent. Source EPA Draft Inventory of U.S. Greenhouse Gas Emissions and Sinks: 1990-2017
Domestic Policy Efforts toward Climate Change Clean Power Plan • In 2007 Supreme Court ruled that GHGs are air pollutants covered by Clean Air Act and that EPA should regulate GHGs if they endanger human health. • In Aug 2015 EPA made final version Clean Power Plan • Final goal -- national electric power CO2 emission reductions by 2030 of 32 percent from CO2 emission levels in 2005. • State level targets - Texas is at 36%. • States were to submit plan in 2016. 2 year extension possible. • Starting date of emission reductions is 2022. • Market-based mechanisms encouraged including interstate cap-and-trade program, carbon tax and tradable renewable certificates • Only existing plants covered. States must address leakage. • Main thrust is fuel and technology switching • EPA made biogenic carbon rules • Power plants are considering cofiring with biomass • Now under Supreme Court stay http://www3.epa.gov/climatechange/ghgemissions/biogenic-emissions.html http://www.epa.gov/cleanpowerplan
State Policy • Twenty-nine states plus the District of Columbia have adopted specific greenhouse gas reduction targets • Policies include carbon pricing, emission limits, energy efficiency mandates and incentives, and steps to promote cleaner transportation. https://www.c2es.org/content/state-climate-policy/
State Policy California Air Resources Board • A trading program • Ag opportunities provide offsets • Participation is voluntary • Protocols are in place for • Forest • Reforestation • Improved Forest Management • Avoided Conversion • Manure management • Rice Cultivation (Dry seed, early drain, wet/dry) http://www.arb.ca.gov/cc/capandtrade/offsets/offsets.htm
Other reasons Why Might We Mitigate? • Industry planning under uncertainty • Demonstration projects • Interests at risk • Multinationals • Need for cheap emission offsets • Firms investing • CCX • Congruence of programs with other agriculturally related societal desires such as farm income support and water quality protection • Development of another market for farm products
Economic Needs Ag perspectiveinelastic vs elastic demand who gains D S’ S’ Price S S D P’ P Q’ Quantity Q Q’ Quantity Q
Mitigative Actions Reduce emissions Capture and destroy Lower emitting energy Nat. Gas, Biogenic feedstocks, Nuclear, Hydrogen, Wind, Solar Alter consumption (meat) Increase energy efficiency Change production to reduce emissions from fossil fuels, rice, coal mines, livestock, fertilization etc Increase sequestration Capture/store- Oceans, Mines, Aquifers (CCS) Link CCS and Bioenergy/biopower - BECCS Biological - Forest, Soils Geoengineer Solar rad. mgt–deflect sunlight, increase reflectivity CO2 removal, biochar, Air capture, Ocean nourish
PotentialSectoral GHG Emission Mitigation Strategies • Agricultural and Forestry Sector • Contributed 4% of global energy-related CO2 emissions in 1995 but about 50% of methane and 70% of nitrous oxide • Conservation Improvement of agriculture (e.g. conservation tillage, reduction of land use intensity, etc.) • Sequestration management • Substitute product production (biofuels) • Altered ag management of cattle, rice, fertilization • Fuel switching • Waste Management Sector • Use of landfill gas for heat and electricity • Increase of waste recycling rates • Utilize waste paper as a biofuel • Energy Sector • Contributed 38 % of global energy-related CO2 emissions in 1995 • Improvement in the energy efficiency of power plants • Fuel switching • Deregulation of the electric power sector to drive technological progress
Potential Sectoral GHG Emission Mitigation Strategies • Buildings Sector • Contributed 31% of global energy-related CO2 emissions in 1995 • Improvement in the energy efficiency of windows, lighting, refrigeration, air conditioning, etc. • Passive solar design & integrated building • Fuel switching • Transportation Sector • Contributed 22 % of global energy-related CO2 emissions in 1995 • Improvement in the energy efficiency of vehicles • Vehicle Fuel switching to natural gas, electricity, biofuels • Subsidize mass transit • Industry Sector • Contributed 43 % of global energy-related CO2 emissions in 1995 • Improvement in the energy efficiency • Material efficiency improvement e.g. recycling, material substitution • Fuel switching Adapted from CC 2001 mitigation p. 29-40
Sectoral Mitigation IPCC WGIII AR5 Table TS.3 | Main sectoral mitigation measures categorized by key mitigation strategies (in bold) and associated sectoral indicators (highlighted in yellow) as discussed in Chapters 7 – 12.
Global Carbon Cycle Figure 6.1 | Simplified schematic of the global carbon cycle. Numbers represent reservoir mass, also called ‘carbon stocks’ in PgC (1 PgC = 1015 gC) and annual carbon exchange fluxes (in PgCyr–1). Black numbers and arrows indicate reservoir mass and exchange fluxes estimated for the time prior to the Industrial Era, about 1750 IPCC, AR5 WG1
Historical Emissions Estimates Sequestration may have the potential to alleviate somewhere in the neighborhood of 25% of the historical atmospheric greenhouse gas accumulation. Source: Apparently this was drawn from W. F. Ruddiman, 2001. Earth's Climate: Past and Future. W. H. Freeman and Sons, New York
Ag Sector Mitigation IPCC WGIII AR5 Table TS.3 | Main sectoral mitigation measures categorized by key mitigation strategies (in bold) and associated sectoral indicators (highlighted in yellow) as discussed in Chapters 7 – 12.
Emit CO2 Absorb CO2 Avoid it – Biofuel Please Pretend the growing stuff includes crops Feedstocks take up CO2 when they grow CO2 emitted when feedstocks burned or when energy product derivatives burned But Starred areas also emit Source of underlying graphic: Smith, C.T. , L. Biles, D. Cassidy, C.D. Foster, J. Gan, W.G. Hubbard, B.D. Jackson, C. Mayfield and H.M. Rauscher, “Knowledge Products to Inform Rural Communities about Sustainable Forestry for Bioenergy and Biobased Products”, IUFRO Conference on Transfer of Forest Science Knowledge and Technology, Troutdale, Oregon, 10-13 May 2005
Comments on strategies Sequestration saturation, permanence, storage cost General uncertainty, permanence, leakage, additionality, transactions costs Bioenergy life cycle accounting cost algae $20 land competition indirect land use
Bringing in Mitigation • Identify emission threats • Permafrost • Peat • Fires • Identify feasible, cheap mitigation possibilities • For threats • For existing systems • Identify ways to grow without growing emissions • Identify ways to maintain and grow food production • Without more emissions • Protecting environment • Incentivedesign
Policies, Measures, and Instruments • Here are a set of policies, measures, and instruments to limit GHG emissions or enhance sequestration by sinks. • Command and control • Taxes on emissions, carbon, and/or energy • Subsidies • Tradable emissions permits (cap-and-trade) • Non-tradable permits • Emission reduction credits • Voluntary agreements • Technology and performance standards • Product bans • Direct government spending and investment (R&D) Adapted from CC 2001 mitigation p. 399-450 http://www.grida.no/climate/ipcc_tar/wg3/224.htm
Policies, Measures, and Instruments • Command and Control • Imposing a specific and inflexible emission standards on sources • Taxes on Emissions, Carbon, and/or Energy • A levy imposed by a government on each unit of emissions or on carbon content of fossil fuels (carbon tax), or on the energy content of fuels • Advantage: 1. Yields cost minimizing allocation • 2. Promotes technological progress • 3. Increases revenues to subsidize R&D • Disadvantage: 1. How to determined an appropriate level of Tax? Cost ($) Marginal control cost A B Tax C D O Emission Reductions (tons) 15
Policies, Measures, and Instruments • Subsidies • A direct payment from the government • Lowers existing subsidies to fossil fuel use, or increasing subsidies for practices reducing emissions or enhance sinks • Tradable Emissions Permits (Cap-and-Trade) • Puts a cap or limit on aggregate GHG emissions on sources • Requires each source to hold permits equal to its actual emissions • Allows permits to be traded among sources • Advantage: Flexibility • Disadvantage: Need to consider transaction costs
Policies, Measures, and Instruments • Subsidies • A direct payment from the government • Lowers existing subsidies to fossil fuel use, or increasing subsidies for practices reducing emissions or enhance sinks Cother Cost of meeting cap Cemitter 100% of cap Percent of Cap by technology
Policies, Measures, and Instruments • Non-Tradable Permits • Puts a cap or limit on GHG emissions on each regulated source • Requires each source to keep its actual emissions below its own cap • Does not allow trading among sources Cother Prespecified share Cost of meeting cap Cemitter Emitter share Other share 100% of cap Percent of Cap by emitter
Policies, Measures, and Instruments • Non-Tradable Permits • Puts a cap or limit on GHG emissions on each regulated source • Requires each source to keep its actual emissions below its own cap • Does not allow trading among sources Cother Prespecified share Cost of meeting cap Cemitter Emitter share Other share 100% of cap Percent of Cap by emitter
Policies, Measures, and Instruments • Tradable Emissions Permits (Cap-and-Trade) • Puts a cap or limit on aggregate GHG emissions on sources • Requires each source to hold permits equal to its actual emissions • Allows permits to be traded among sources • Advantage: Flexibility • Disadvantage: Need to consider transaction costs Cother Adding a trade partner Trade partner cost goes up with percent of cap assumed Cost of meeting cap Cemitter Emitter share Other share 0% of cap All bought 100% of cap Percent of Cap by emitter
Policies, Measures, and Instruments • Voluntary Agreements • An agreement between a government authority and one or more private parties • A unilateral commitment to achieve environmental objectives or to improve environmental performance beyond compliance • Technology and Performance Standards • Establishment of minimum requirements for products or processes to reduce GHG emissions associated with the manufacture or use of the products or processes • Product Bans • Prohibition on the use of a specified product in a particular application, such as hydrofluorocarbons (HFCs) in refrigeration systems
Policies, Measures, and Instruments • Direct Government Spending and Investment (R&D) • Government expenditures on research and development (R&D) measures to lower GHG emissions or enhance GHG sinks Remarks: (1). A group of countries can implement one or a combination of these instruments. (2). If we control too much at the present time, the current generation pays high price but the future generation gains benefit, or a vice versa. Adapted from CC 2001 mitigation p. 399-450 http://www.grida.no/climate/ipcc_tar/wg3/224.htm
Policies, Measures, and Instruments • Emission Reduction Credits • Combination of a deposit or fee (tax) on a emissions with a refund or rebate (subsidy) for emission reductions • Credits are implemented through • Offset policy • Bubble policy • Netting within the firms • Banking • Advantage: allow growth • Disadvantage: quantifiability, and monitoring and enforcement
Policies, Measures, and Instruments • Direct Government Spending and Investment (R&D) • Government expenditures on research and development (R&D) measures to lower GHG emissions or enhance GHG sinks Remarks: (1). A group of countries can implement one or a combination of these instruments. (2). If we control too much at the present time, the current generation pays high price but the future generation gains benefit, or a vice versa. Adapted from CC 2001 mitigation p. 399-450 http://www.grida.no/climate/ipcc_tar/wg3/224.htm
How Incent Mitigation • Voluntary • Carbon pricing system • cap and trade • tax • Tax high emitting activities or fossil fuels • Subsidize low emitting activities or fuels • Increase energy efficiency. • Increase use of low GHG-emitting electricity generation options • renewable energy sources. • improved transmission infrastructure, • offering long-term stability in financial incentives • encouraging private research, development, and deployment • testing and demonstration of new-generation nuclear power • Develop and demonstrate carbon capture and storage • Advance low GHG-emitting transportation options. • vehicle efficiency, • energy efficient modes of passenger and freight transport, and • advancing low-GHG fuels (such as cellulosic ethanol). • Accelerate retirement, retrofit or replacement of high emissions infrastructure. • Create new technology choices • Fri, R., M. Brown, D. Arent, A. Carlson, M. Carter, L. Clarke, F. de la Chesnaye, G. Eads, G. Giuliano, A. Hoffman, R.O. Keohane, L. Lutzenhiser, B.A. McCarl, M.C. McFarland, M.D. Nichols, E.S. Rubin, T. Tietenberg, J. Trainham, L. Geller, A. Crane, T. Menzies, and S. Freeland, America's Climate Choices Limiting the Magnitude of Future Climate Change, National Academy Report, The National Academies Press, Washington, D. C, 2010.
NAS Mitigation recommendations • Adopt economy-wide carbon pricing system. • Complement the carbon price with policies to: • realize potential for near term emissions reductions through energy efficiency and low emission energy; • establish feasibility of CCS and nuclear; • accelerate retirement, retrofitting or replacement of GHG emission-intensive infrastructure. • Create technology - research/stimulated innovation. • Design/ implement policies to promote equity • Establish US as a leader to stimulate other countries. • Enable flexibility and experimentation with policies. • Design policies that balance durability and consistency with flexibility and capacity for modification as we learn • http://dels.nas.edu/Report/Limiting-Magnitude-Climate-Change/12785
Why Pricing? • Internalizes externality • Improves efficiency • Stimulates innovation and conservation • But for Ag the question is coverage – • Are all ag possibilities covered? • Do we want to extend cap to agriculture • Answer to both is generally no • Cap and trade has a bad political reputation • Attention has turned to voluntary programs like that in California • Producers can optin if they so choose, and are not capped
GWP, GTP and Climate Change GWP is used to make comparisons of relative contributions among GHGs to global warming by comparing the ability of each gas to trap radiation in the atmosphere over a chosen time horizon. Global Temperature change Potential (GTP), which is change in GMST at a chosen point in time relative to CO2 IPCC uses CO2 as a reference gas with a GWP or GTP of 1 • CO2 lifetime is complicated by multiple physical and biogeochemical processes in the ocean and the land. For a pulse of about 1000 PgC, about half is removed within a few decades, but the remaining fraction stays in the atmosphere for much longer. About 15 to 40% of the CO2 pulse is still in the atmosphere after 1000 years. Source: Climate Change 2014: The Scientific Basis, Table 8.7
Multi-Gas GHG Total Forcing Greenhouse gas radiation reflection Increase in CO2 concentration Plus CH4 N2O Energy related emissions Energy – development relationship Growth of BRIC economies • Pre industrial 275 Counting Non CO2 • 345 this exceeds 493 (2017) • 2019 411 Data 1700-2017 http://www.epa.gov/climatechange/science/indicators/ghg/global-ghg-emissions.html http://www.esrl.noaa.gov/gmd/aggi/aggi.html