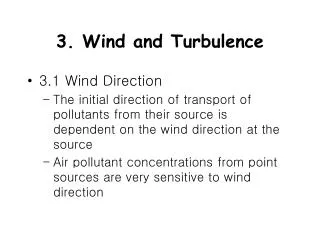
3. Wind and Turbulence
550 likes | 1.2k Views
3. Wind and Turbulence. 3.1 Wind Direction The initial direction of transport of pollutants from their source is dependent on the wind direction at the source Air pollutant concentrations from point sources are very sensitive to wind direction.

3. Wind and Turbulence
E N D
Presentation Transcript
3. Wind and Turbulence • 3.1 Wind Direction • The initial direction of transport of pollutants from their source is dependent on the wind direction at the source • Air pollutant concentrations from point sources are very sensitive to wind direction
If wind is blowing directly toward a receptor, a shift in direction of as little as 5 degrees causes concentrations at the receptor to decrease about: • * 10% under unstable conditions • * 50% under neutral conditions • * 90% under stable conditions
The direction of plume transport is important in source impact assessment where there are sensitive receptors or several sources or for model validation through measurements.
3.2 Changes in Wind Direction • * Ekman spiral, causes a clockwise rotation with altitude near surface • * Wind shear, especially near the surface, imparts vertical changes • * At higher altitudes, horizontal thermal structure may dominate wind shifts
3.2.1 Geostrophic temperature advection • Cold advection: flow across isotherms from a cold region into a warmer one • Warm advection: flow across isotherms from a warm region into a colder one
The geostrophic wind changes direction with height within a layer in which temperature advection is occurring • Consider the case of cold and warm air masses colliding: • geostrophic wind blows parallel to isobars • geostrophic wind rotates with altitude through layer to adjust to changes in temperature
Cold advection is characterized by backing (CCW rotation) with height • Warm advection is characterized by veering (CW rotation) with height • This change in geostrophic wind is attributed to the thermal wind in the layer • Example
Figure. Vertical shear of the geostrophic wind in the 1000-500 mb layer at selected locations at 00 GMT 20 Nov 1964. Light arrow represent geostrophic wind at 1000 mb level, heavy arrows represent geostrophic wind at 500 mb level, dashed arrows represent thermal wind vector for 1000-500 mb layer. Letter C denotes cold advection and W denotes warm advection
3.3 Wind Speed • 3.3.1 Power law • Wind speed generally increases with height • A number of expressions describe the variation of wind speed in the surface boundary layer, but a power law profile has frequently been used in air pollution work:
where, u(z) is the wind speed at height z • u(za) is the wind speed at anemometer height, za (typically 10 m) • p is dimensionless parameter that varies with atmospheric stability and surface roughness the rougher the terrain, the more the windspeed near the surface will differ from windspeed higher up (i.e. increasing surface roughness requires higher values of p)
3.3.2 Dilution • one effect of wind speed is dilution of continuous emissions from point sources • dilution takes place in direction of plume transport • wind speed must be taken at point of emission to determine dilution
3.3.3 Transport time • wind speed affects transport time from source to receptor • wind speed also effects buoyant plume rise; • the stronger the wind, the lower the plume
3.4 Turbulence • Big whirls have little whirls that feed on their velocity • And little whirls have lesser whirls and so on to viscosity. • L. F. Richardson (1881-1953) English physicist and meteorologist
Turbulence is highly irregular motion of the wind (wind gusts) • The atmosphere does not flow smoothly but has seemingly random, erratic motions • Superimposed on the mean flow are many eddies covering a wide range of sizes
Two different causes of turbulence: • 1. Mechanical turbulence - induced by vertical shear from horizontal flow • 2. Thermal turbulence - induced by convection of heated air
Figure. a) mechanical, b) thermal turbulence
3.4.1 Thermal turbulence • eddies are large and variable in size • low frequency (changes over minutes) • the larger the eddy, the longer the dissipation time
3.4.2 Mechanical turbulence • eddies are small and less variable in size • high frequency (change over time period of seconds) • typically found in lowest kilometer of atmosphere and in discrete patches or layers (CAT - clear air turbulence) • most clear air turbulence and near ground eddies result from small-scale wavelike undulations that develop spontaneously when the vertical shear from horizontal flow exceeds some critical value
a) stable fluid stratification • b) vertical shear is weak, no disturbances develop • c) shear exceeds a critical value, undulations spontaneously occur and evolve (c-f) • e) wave rolling billows produce intense velocity shears and density gradients, creating further instability • f) flow breaks apart into small-scale turbulent motions
This cascade of energy to smaller scales takes place by two discrete steps: • 1. waves amplify at the expense of the kinetic energy of the mean flow • 2. waves break up to give their energy to smaller-scale turbulent motion
Waves must overcome stability of air to begin cascade • The greater the stability, the larger the critical shear
Stability criterion for spontaneous growth of small-scale eddies in a stably stratified atmosphere with vertical wind shear can be expressed by the dimensionless Richardson number:
The smaller the value of Ri, the less stable flow with respect to the shear instability • Commonly accepted value for onset of shear instability is Ri = 0.25. • Once turbulence is established within a shear layer, energetical considerations indicate that it should be sustained so long as Ri< 1.0 • The value of Ri can be determined from wind and temperature data from radiosonde ascents • Stable air yields severe CAT • Less stable air has widespread, but weak, eddies not of sufficient intensity to be classified as CAT
3.5 Air Pollution Climatology • Climatology refers to averaged meteorological variables over a long period of record (several years) • Hourly measurement of many surface variables • Radionsondes launched near 00 and 12 GMT for vertical temperature and humidity profiles (wind determined by tracking)
3.5.1 Wind Roses • graphical means to summarize wind magnitude, direction and frequency, allowing easy interpretation • stability wind rose indicates the Pasquill stability class frequencies for each direction (A: very unstable; F: very stable)
Figure. Stability rose for OHare Airport, Chicago, 1965-1969
3.5.2 Pollution Roses • plotting average concentrations (or frequency of concentrations above some particular concentration) wind roses and pollution roses are typically superimposed on the same chart
Figure. Average concentrations of hydrocarbon and sulfur dioxide for each wind direction frequency in two classes (0-7 mph, and greater than 7 mph)