Download
1 / 19
190 likes | 339 Views
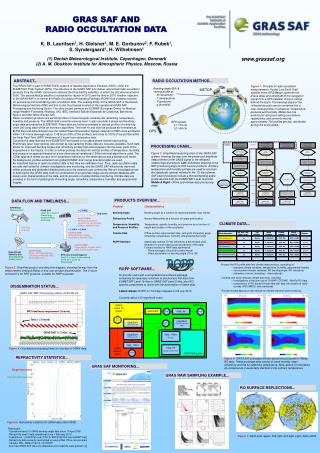
Solar wind turbulence from radio occultation data. Chashei, I.V. Lebedev Physical Institute, Moscow, Russia Efimov, A.I., Institute of Radio Engineering & Electronics, Moscow, Russia Bird, M.K. Radio Astronomical Institute, Univ. Bonn, Bonn, Germany. TURBULENCE.

E N D
Solar wind turbulence from radio occultation data Chashei, I.V. Lebedev Physical Institute, Moscow, Russia Efimov, A.I., Institute of Radio Engineering & Electronics, Moscow, Russia Bird, M.K. Radio Astronomical Institute, Univ. Bonn, Bonn, Germany
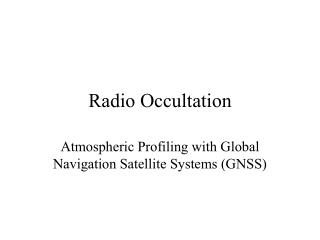
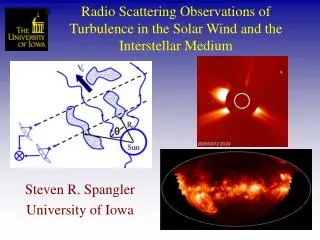
TURBULENCE • Turbulence is a permanent property of the solar wind. • Fluctuations spectra of B, N, V… cover many decades in wavenumbers / frequencies. • Formed flow R > 20 RS , in situ + radiooccultation data. • Acceleration region: R < 10 RS, no in situ data. • Below we concentrate mainly on Galileo and Ulysses spacecraft data.
OBSERVATIONAL DATA • SPACECRAFT GALILEO (1994-2002) ANDULYSSES (1991-1997) • HIGH STABILITY RADIO SIGNALS AT S-BAND (2295 МHz) • GROUND BASED NASA-DSN TRACKING STATIONS: • GOLDSTONE(DSS 14) • CANBERRA (DSS 43) • MADRID (DSS 63) • MEASUREMENTS OF FREQUENCY FLUCTUATIONS • SAMPLING RATE: 1 Hz • RECORDS AT INDIVIDUAL STATIONS → • TEMPORAL POWER SPECTRA OF FREQUENCY FLUCTUATIONS • CROSS CORRELATION OF OVERLAPPING RECORDS → – VELOCITY OF THE DENSITY IRREGULARITIES • SOLAR OFFSET R: 7 R < R < 80 R
TEMPORAL POWER SPECTRA OF THE FREQUENCY FLUCTUATIONS • Typical temporal spectra are power law • Power law interval is bounded by the frequency of the turbulence outer scale at low frequencies and the noise level at high frequencies • Power law spectral index of the temporal frequency fluctuation spectrum is related to the power law index of the 3D spatial turbulence spectrum р by the equation = р-3
RADIAL EVOLUTION OF THE SPECTRAL INDEX (HIGH HELIOLATITUDES,R = 22-30 R)
FRACTIONAL LEVEL OF DENSITY VARIANCE ( SLOW SOLAR WIND,GALILEO)
DENSITY TURBULENCE OUTER SCALE Radial dependence approximation L0( R ) = A ( R / RS )m with A = 0.24 RS and m = 0.8 , very close to linear.
RESULTS • A change of the turbulence regime occurs at the transition from the acceleration region to the region of the developed solar wind. (Also, Woo & Armstrong, 1979) • FR fluctuations measurements in the acceleration regions shows that flat flicker type spectra with p=3 are also typical for magnetic field fluctuations (Chashei, Efimov, Bird et al., 2000). Recently (Chashei, Shishov & Altyntsev) the evidences were found from the analysis of angular structure of the sources of microwave subsecond pulses for such spectra in the lower corona. • The heliocentric distance of this change of turbulence regime is greater for the fast solar wind than for the slow solar wind during the period of low solar activity.
RESULTS • The fractional density fluctuations tend to increase slowly with increasing heliocentric distance. • Turbulence outer scale increases approximately linear with increase of heliocentric distance in the range 10RS < R < 80 RS . • Galileo data (1994-2002): no changes of slow wind turbulence during the solar activity cycle.
TURBULENCE MODEL(acceleration region) • The source of turbulence is a spectrum of Alfvén waves (magnetic field fluctuations), propagating away from the Sun. • Slow and fast magnetosonic waves are generated locally via nonlinear interactions with Alfvén waves. Density fluctuations are dominated by slow magnetosonic waves. • Turbulence is weak in the solar wind acceleration region (R < 20 R). • The fractional level of turbulent energy increases with increasing heliocentric distance. • Temporal power spectra are flat ( = 0, р = 3.0). No cascading of turbulence energy from the turbulence outer scale to smaller scales.
TURBULENCE MODEL(change in turbulence regime) • The turbulence power spectrum of the developed solar wind in the inertial spectral range is defined by nonlinear cascading processes. Source of turbulence energy – l.f. (outer scale) Alfven waves. Nonlinear generation of magnetosonic waves (density fluctuations) (Spangler &Spitler, Ph. Pl., 2004). Spectra: • Kolmogorov (p=11/3) or • Iroshnikov-Kraichnan (p=7/2) spectra. • The change in turbulence regime is caused by the increase of fractional turbulence level (and increase of fractional level of fast magnetosonic waves compared with slow magnetosonic waves). • The more distant transition for the fast solar wind may be explained by the lower value of the plasma parameter = 4P/B2 , i.е. by stronger ambient magnetic fields above the coronal holes.
TURBULENCE MODEL (outer scale) • Data are related to the region of formed solar wind flow. • Model : Wk=C1k-nat k<k0 , Wk=C2 k-mat k>k0 ; linear (WKB) propagation of Alfven waves at k<k0 ; nonlinear cascading at k>k0 (Kolmogorov, Kraichnan, 4-waves interactions); equal linear and nonlinear increments at k=k0; k0 (R, n, m). LF spectrum can be assumed as flicker spectrum with n=1 (Helios =>Denscat, Beinroth & Neubauer, 1983; Ulysses => Hourbury & Balogh, 2001). • Comparison of the models with observational data: best agreement at n=1 is found for the Kraichnan turbulence.
CONCLUSIONS • Turbulence regimes in the acceleration region and in the formed solar wind are strongly different. • Sufficiently good agreement between the observational data and the model.