Download
1 / 26
260 likes | 447 Views
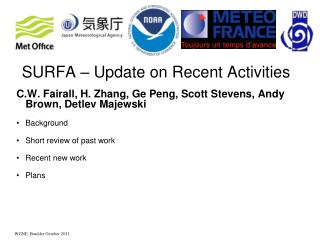
SURFA – Update on Recent Activities. C.W. Fairall, H. Zhang, Ge Peng, Scott Stevens, Andy Brown, Detlev Majewski Background Short review of past work Recent new work Plans. About SURFA (Surface Flux Analysis).

E N D
WGNE Boulder October 2011 SURFA – Update on Recent Activities C.W. Fairall, H. Zhang, Ge Peng, Scott Stevens, Andy Brown, Detlev Majewski • Background • Short review of past work • Recent new work • Plans
About SURFA (Surface Flux Analysis) • Driver: Surface processes are key in improving NWP & climate model forecast skills • Objective: SURFA is to institutionalize the evaluation of near real-time NWP (& Climate Model & Reanalysis) fluxes and related fields with high quality reference data • Interested Groups: WCRP WGSF, WGNE, GEWEX … WGNE Boulder October 2011
List of model variables • Global forecast fields on regular latitude – longitude grid • Resolution 0.25° x 0.25° • Initial date: 12 UTC • Forecast ranges: +12h to +36h, 3-hourly • Two constant fields: ORO, LSM • 16 instantaneous variables: e.g. PS, ALBEDO, SEAICE, U_10M, … • 13 accumulated variables: e.g. LS_PREC, CO_PREC, SO_NET, … • 3 optional variables: TH_DO_CS, SO_DO_CS, PBL_DEPTH WGNE Boulder October 2011
BIG PICTUREOceanic Near-Surface ObservationsGulev et al., Surface energy and CO2 fluxes in the global ocean-atmosphere-ice system. Plenary White Paper, OceanObs2009 • Satellite • J-Ofuro, HOAPS, EFREMER, Goddard • Blended/Hybird • OAFlux (WHOI), CORE (NCAR), U. Wash. • In situ • NOAA ESRL Ship-based (40 cruises) • SAMOS Archive of R/V (20 vessels) • Ocean Sites Archive flux buoys (20 sites) • Operational TAO/PIRATA/RAMA (200 sites) • VOS/VOSCLIM Volunteer vessels (declining numbers) WGNE Boulder October 2011
Previous Data analysis • Preliminary study with WHOI Stratus buoy • Additionally high quality ship observations (cloud and BL observations) • Some comparisons with VOSClim (E. Kent) • Some comparisons with land fluxes (Zhang) • Seawinds (Peng) New Analyses * OceanSites buoys – Peng et al. * Ship-buoy intercomparisons WGNE Boulder October 2011
Evaluating Global High-Resolution Remotely-sensed Ocean Surface Winds, NWP Short-Range Forecast Winds, and NCEP/CFRS Reanalysis Winds with oceanSITES Buoy Winds Ge Peng1,2 , Scott Stevens3, Huai-min Zhang2 1STG, Inc 2Remote Sensing and Applications Division National Climatic Data Center 3CICS-NC Other Collaborators Jean-Raymond Bidlot: ECMWF Helmut Frank: DWD Masakazu Higaki: JMA Bill Hankins: STG, INC/NCDC WGNE Boulder October 2011
Data Outline • NCDC Blended Sea Winds: 6-hourly, 0.25ox0.25o grid, ice free ocean • NWP Winds (ECMWF, DWD, JMA): 3-hourly, 0.25ox0.25o grid, global • NCEP/CFSR Winds: hourly, T382 grid, 0.31ox0.31o at the tropics, global • oceanSITES Winds: daily 2009, only stations with more than 75% wind measurements, adjusted to the 10-m height assuming a logarithmic (neutral) wind profile with roughness length = 0.15 mm • This is a continuation of a previous study using three oceanSITES TAO buoys in the equatorial Pacific (Peng et al. 2011). WGNE Boulder October 2011
c Red triangles are the oceanSITES station locations that have surface wind measurements. Encircled stations are used in this extended analysis (more than 75% records existed for 2009). WGNE Boulder October 2011
Time Series and PSD of u & v Indian Ocean WGNE Boulder October 2011
Pacific Ocean WGNE Boulder October 2011
Atlantic Ocean WGNE Boulder October 2011
Bias and rms of u-comp Mean 0.025 m/s 0.1696 m/s 0.005 m/s -0.148 m/s Basin mean of all wind products 1.45 m/s 1.83 m/s 1.38 m/s Mean 1.58m/s WGNE Boulder October 2011
Bias and rms of v-comp Mean -0.02 m/s -0.082 m/s -0.108 m/s 0.155 m/s Basin mean of all wind products 1.70 m/s 1.99 m/s 1.45 m/s Mean 1.74m/s WGNE Boulder October 2011
Average Wind Direction and Directional Anomaly WGNE Boulder October 2011
Cross-Correlation for u- and v-comp Mean 0.91 0.936 0.896 0.908 Mean 0.84 0.914 0.757 0.876 WGNE Boulder October 2011
Summary • Improved NWP short-range winds a result of improved models and analyses assimilating satellite and buoy winds • Good correlation between various winds with in situ winds, with CFSR winds having the highest cross-correlation coefficients • In addition to the systematic bias in meridional winds found previously in equatorial Pacific stations, a smaller negative/positive bias can be seen at 8oS, 67oE /12oN, 23oW • The averaged bias values of all locations/products could give a more optimal impression – the devil is in the details WGNE Boulder October 2011
Future Work • Other years (2010) • Other centers (French and UK Met Offices) • Cruise winds (collaborating with Chris Fairall) WGNE Boulder October 2011
Ship and Flux Reference Buoys WHOTS @ 22 deg 45N, 158 deg W NTAS @ 14 deg 50'N, 51 deg W STRATUS @ 19 deg S, 85 deg W SHOA DART @ 19 deg S, 74 deg W KEO @ 32.25 deg N, 144 deg 30’E PAPA @ 50 deg N, 145 deg W. WGNE Boulder October 2011
Stratus cruise tracks WGNE Boulder October 2011
20˚S surface heat budget 250 200 solar 150 100 net flux (W m-2) 50 sensible 0 -50 longwave -100 latent -150 -86 -84 -82 -80 -78 -76 -74 WGNE Boulder October 2011 longitude
Model WHOI ORS buoy WHOI (1984-2002) analysis CORE (1984-2004) NOAA ship observations GFDL CM2.1 IROAM October heat fluxesat 20˚S:assess analyses and models -40 -40 latent -80 -80 -120 -120 100 85 70 100 85 70 0 0 -10 -10 sensible -20 -20 -30 -30 -40 -40 100 85 70 100 85 70 0 0 -25 -25 longwave -50 -50 -75 -75 -100 -100 100 85 70 100 85 70 300 300 250 250 solar 200 200 150 150 100 85 70 100 85 70 160 160 120 120 80 80 net 40 40 0 0 WGNE Boulder October 2011 100 85 70 100 85 70 west longitude
Wind and Temperature Comparisons Comparison of temperatures for Oct 2008: Upper panel – SST; lower – 10-m air temperature. ECMWF – green; ECMWF+warm layer – magenta; DWD – blue; Buoy – red dots. Comparison of 10-m wind speeds for Oct 2008: Upper panel – speed; middle – zonal wind; lower – meridional wind. ECMWF – green; DWD – blue; Buoy – red dots. WGNE Boulder October 2011
Ship-Buoy Intercomparisons WGNE Boulder October 2011
Data analysis plans (Chris Fairall) • Use all NWP sources available in archive • Focus on 6 buoys that have surface met and flux observations • Additionally high quality ship observations (cloud and BL observations) • Analysis along lines of preliminary work • means, fluxes, crude cloud variables WGNE Boulder October 2011
Future: NSF OOI BuoysHigh Latitude Emphasis WGNE Boulder October 2011