Download
1 / 35
370 likes | 630 Views
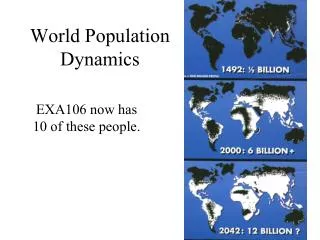
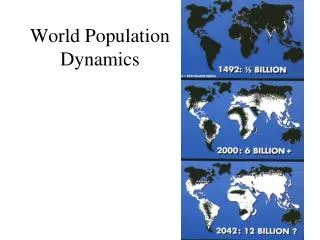
World Population Dynamics. The Population Explosion. The Population Explosion. Population Explosion—a recent event. Last 200 years or less for MDCs Industrial Revolution Improvement in sanitation and medicine Last 50 years or less for LDCs

E N D
Population Explosion—a recent event • Last 200 years or less for MDCs • Industrial Revolution • Improvement in sanitation and medicine • Last 50 years or less for LDCs • Transfer of technology, i.e. medical, agricultural (Green Revolution)
Frequency of Vital Events: The Population Clock • Population Clock http://www.census.gov/main/www/popclock.html • Vital Events (per time unit) http://www.census.gov/cgi-bin/ipc/pcwe • The global population reached 6 billion in fall of 1999 • The global population is reached 7 billion in October 2011 • Currently @7.2 billion
Rates of Global Pop. Changeuse: International Data Base http://www.census.gov/ipc/www/idbnew.html, then Online Demographic Aggregation • CBR (crude birth rate) = number of births per 1000 population • 1990: 24 Today: 21.3 • CDR (crude death rate) = number of deaths per 1000 population • 1990: 9 Today: 8.93 • growth rate = birth rate - death rate (often in %) • 1990: 1.5% Today: 1.3% • growth rates have come down
Special Kinds of Fertility and Mortality Rates • TFR (total fertility rate) = • number of children born to a woman during her reproductive years (or life time) • 1990: 3.1 2000: 2.8 • IMR (infant mortality rate) = • infant deaths per 1000 live births (infant < 1 yr) • 1990: 62 2000: 56 (1900: 200)
Population, population change, growth rates • Population: number of persons • Population change: increase in the number of persons (per year) • Growth rates: rate of change (per year)
Doubling Time • Number of years in which a population reaches twice its size • doubling time can be approximated using growth rates • doubling time = 69 : growth rate • rate: 1.4 doubling time: 49 • rate: 2.0 doubling time: 34.5 • rate: 0.5 doubling time: 138 • rate: -0.5 doubling time: ????
Population Pyramids • Graphic device: bar graph • shows the age and gender composition of a region • horizontal axis: gender • male: left-hand female: right-hand • absolute number of people or % • vertical axis: age • 5-year or 10-year age groups
Five Stages of the Demographic Transition • birth rates, death rates and growth rates systematically change through time as societies change: • modernize, urbanize • gain access to technology
Stage 1 • high birth rates, high (at time erratic) death rates, low growth rates • stage for much of human history, traditional societies • practically no country today
Stage 2 • high birth rates, declining death rates, rising growth rates • improvements in sanitation (water) and medicine • in Europe during Industrial Revolution • in developing countries since the 50s/60s • much of Africa today, some countries of Asia (Afghanistan, Nepal, etc.)
Stage 3 • continued decline of death rates, declining birth rates, growth rates decline from high to lower levels • change in behavior: adaptation to lower death rate, in particular infant mortality rate • economic change: urbanization (incentive to have fewer children) • Mexico today
Stage 4 & 5 • Stage 4: low birth rates, low death rates, low growth rates • United States today • Stage 5: low birth rates, rising death rates, declining growth rates (if birth rates drop below death rates: negative growth rates) • Western Europe, Japan
Population Pyramids • Population Pyramids on the Web http://www.census.gov/ipc/www/idbpyr.html
Population Pyramids and Demographic Stages • characteristics shapes of ‘pyramids’ • wide base (true pyramid) • wide middle (bulge), somewhat wider base • urn- or bottle-shaped • reversed pyramid • different shapes--different dynamics
Population Pyramid and Demographic Transition • Stage 2: wide base
Population Pyramid and Demographic Transition • stage 3: wide middle
Population Pyramid and Demographic Transition • stage 4: slender
Population Pyramid and Demographic Transition • stage 5: narrow base
Why does this matter? • In 1900, Europe accounted for 20 percent of the world's population. Today, this figure is down to 12 percent. By 2050 it will drop to 7, by the end of the 21st century to 4 percent. • Today, India and China together account for 37 % of the world’s population.
Population and Energy • China: 2000-2005: 8 % of Global oil consumption but 27 % of growth in global consumption. • World’s second largest consumer and third largest producer of primary energy. Meets 90% of needs with domestic supplies, mostly coal. • India: World’s 5th largest consumer. By 2030 expected to become 3rd largest, overtaking Japan and Russia. • India has only 0.4 % of the world’s proven oil reserves and is expected to run out of coal